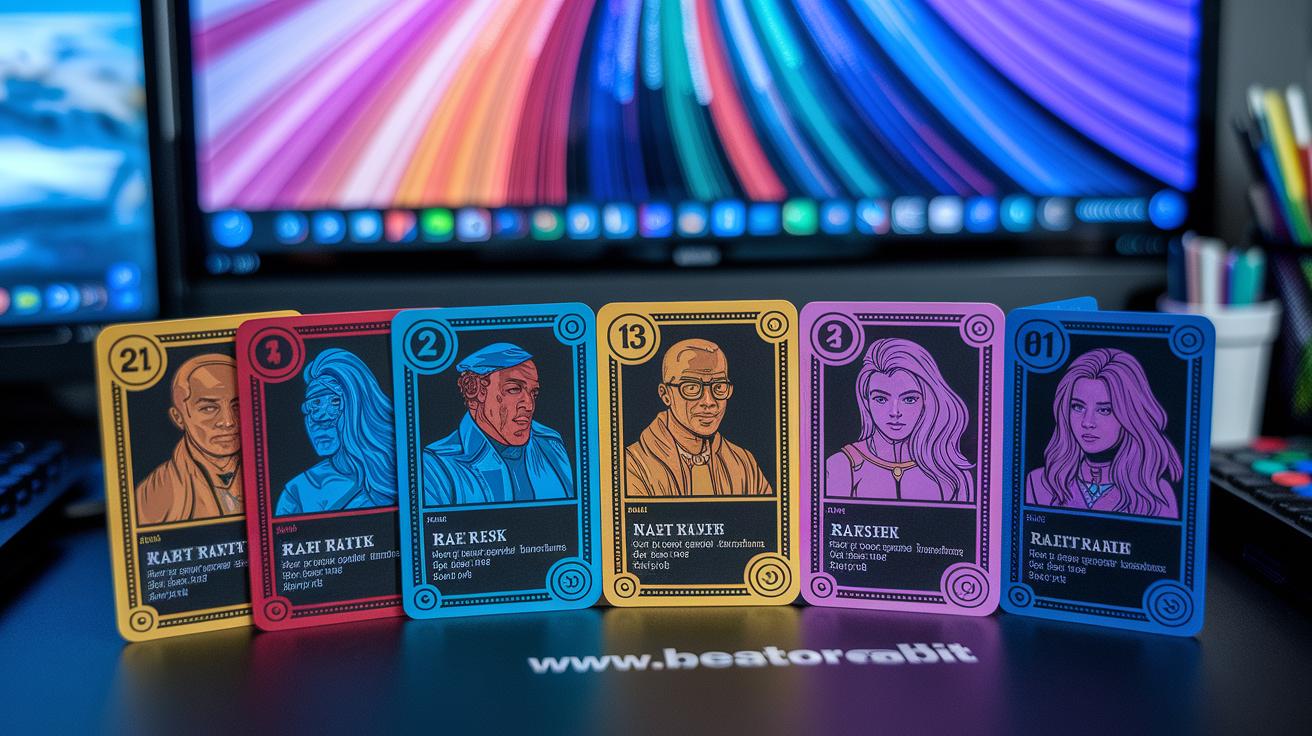
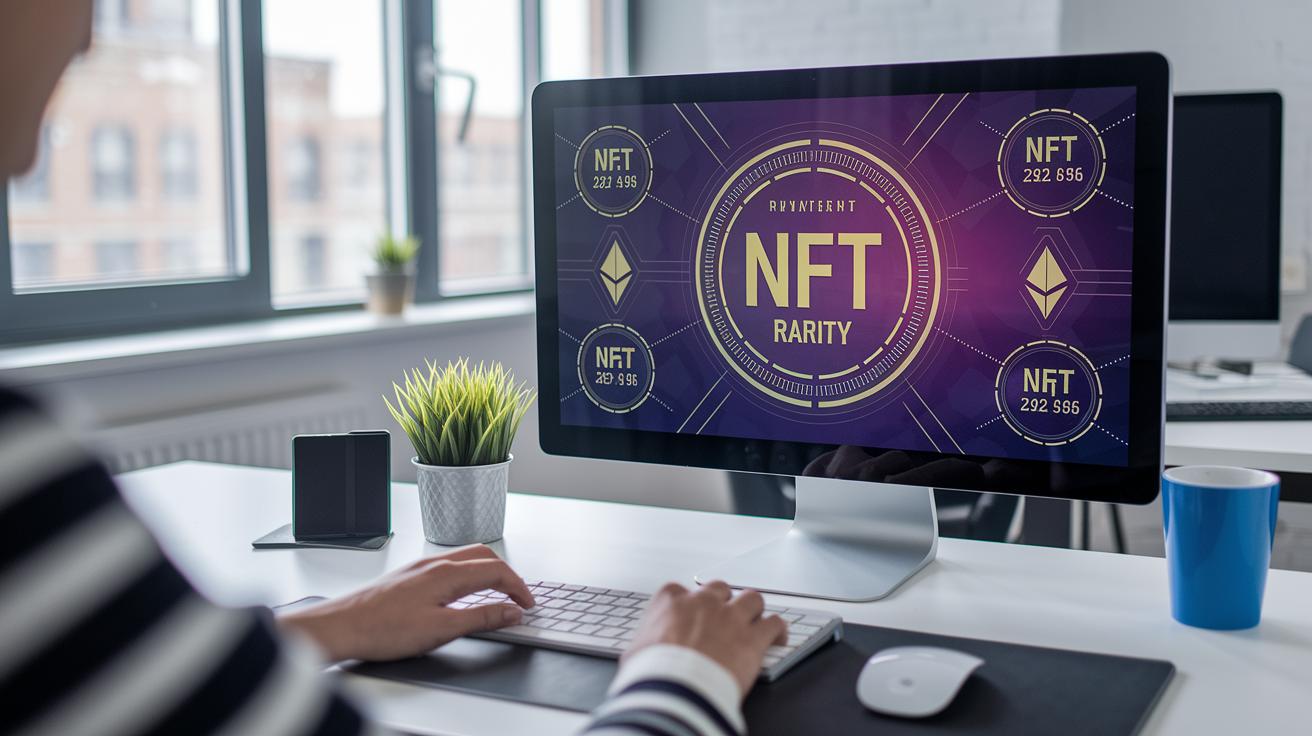
Ever wonder what makes an NFT (a unique digital asset) special? In this guide, you'll find simple, clear steps to figure out NFT rarity. Think of it like adding up test scores to get an overall grade or choosing the rarest card from a deck.
We break each method down so it's easy to follow, just like ticking off items on a checklist. Whether you're a curious collector or just getting started, these techniques can help you spot tokens with extra value. In short, this guide shows you how to see the subtle differences that make an NFT stand apart in the market.
Step-by-Step Guide to Calculating NFT Rarity

NFT rarity tells you how unusual a digital asset is within its group by looking at its supply and demand. This idea helps collectors and sellers see how special a token is and what it might be worth. Here are four simple ways to work out NFT rarity.
-
Average Trait Rarity
To use this method, add up the percentages that show how often each trait appears, then divide by the total number of traits. In other words, it gives you an overall average score. Think of it like averaging test scores to see how well someone did overall. Use this method when you need a clear snapshot of a token's common features. -
Trait Rarity Ranking
With this approach, you pick out the one rarest trait and use that to rank the NFT. It is like finding the rarest gem in a collection; even one unique quality can make a token stand out. This technique works very well when that one trait is a big deal for the token’s value. -
Statistical Rarity
This method multiplies the percentages for each trait to get a combined rarity number. Imagine it as combining several small probabilities to see just how special the mix of traits is. This approach helps you understand how the different traits work together to influence overall rarity, kind of like calculating compounded odds. -
Rarity Score
The rarity score uses a more detailed approach by giving each trait a weight based on how rare it is. This method gives the best overall picture and even allows for checks with on-chain verification using smart contracts for NFTs (smart contracts are computer programs that run on a blockchain, which is a secure, digital record system). It captures the finer points of market trends to show the token's real value.
Comparing these methods side by side lets you choose the one that best fits how you view a token’s value. This flexible approach means you can pick a score that takes both simple numbers and market feelings into account.
Understanding Key Rarity Metrics for NFTs

The NFT rarity score is a simple way to see how unique a token is by checking its traits in a collection. It helps you figure out its value without all the confusing jargon. One of the main numbers here is trait frequency, which is just the percentage of tokens that share a specific trait. For example, if only 10% of tokens sport a special background, that trait's frequency is 10%. Often, this is verified using secure on-chain metadata, kind of like checking details in a safe digital ledger.
Next, there's rarity distribution. This number shows how different the percentages are across a collection. When you see a wide range, it tells you that some traits are much rarer than others, which can have a big impact on a token's overall score.
Then we have the rarity index. Imagine it like averaging scores in sports to get an overall rating; it takes every trait's rarity and weighs them to give you one clear number. It’s a handy way to compare tokens by their standout features.
Lastly, the rarity coefficient steps in as an adjustment factor. It tweaks the rarity score based on what’s happening in the market right now, so the score matches current trends. Each metric plays its part in painting a complete picture of a token’s uniqueness.
By putting these numbers together, you get a well-rounded view that helps both seasoned collectors and newbies understand what makes an NFT valuable.
Exploring Common NFT Rarity Calculation Methods
Average Trait Rarity
This method finds the average of trait percentages by adding them up and dividing by how many traits there are. For example, if a token from the bored apes nft collection has a 0.1% chance for "Legendary Fur," that tiny number pulls the overall average down, showing that the token is likely very rare.
Trait Rarity Ranking
With this approach, you focus on the single rarest trait an NFT has. It works great when one unique feature really stands out and boosts market interest, kind of like finding that special ingredient in your favorite recipe.
Statistical Rarity
This method multiplies the percentages of each trait together to create a combined rarity score. It helps show how mixing common and uncommon traits builds an overall profile, much like blending different flavors to get a unique taste.
| Method | Formula | Best Use Case |
|---|---|---|
| Average Trait Rarity | Sum of trait percentages ÷ number of traits | Gives a clear, broad view of trait distribution |
| Trait Rarity Ranking | Focus on the rarest trait only | Perfect for highlighting one standout feature |
| Statistical Rarity | Product of each trait’s percentage | Ideal for understanding how combined traits build rarity |
Tools for NFT Rarity Analysis and Calculation
Automated tools are a real game changer when it comes to figuring out NFT rarity. They do all the heavy lifting by running complex calculations and showing clear, real-time insights. Instead of crunching numbers by hand, these tools tap into blockchain records (a secure, digital ledger) and on-chain metadata quickly. They help investors spot tokens with unique features without getting bogged down in the details.
These platforms have easy-to-use interfaces and lively charts that make tracking market trends feel simple. Whether you are a seasoned trader or just starting out, they simplify a process that would otherwise be a real headache. In short, each tool acts as a trusty guide in the ever-changing world of NFTs.
Take Rarity Sniper, for example. It supports many blockchains, 18 in fact, and offers one combined rarity score trusted by a wide community. Then there’s Rarity.tools. Active since April 2021, it gives you four different calculation methods along with handy filters for traits.
Trait Sniper stands out by delivering instant rankings and even comes with a special Chrome extension that lets you check floor prices right on major NFT marketplaces. Meanwhile, Icy.tools hooks you up with live charts, non-stop data feeds, and options for a premium upgrade if you need more power.
And for those into Solana collections, MoonRank uses statistical methods to give you accurate rarity scores. Each tool may focus on different aspects, but they all make it easier to calculate NFT rarity for collectors and traders alike.
Really, when it comes to navigating the fast-paced NFT market, these tools bring clarity and ease, letting you keep up with trends and make smarter decisions every step of the way.
Best Practices and Pitfalls in NFT Rarity Evaluation

When you set out to evaluate the rarity of NFTs, it all begins with making sure your data is reliable. Start by checking that every piece of metadata (the digital details that describe each NFT) is correct, kind of like double-checking a recipe before you start baking. It really helps to use different methods to compare your results, much like reading several reviews before deciding on a restaurant. Stick with trusted tools that have proven themselves in the market. And don’t forget to refresh your rarity scores whenever you see new traits emerge, just as a farmer might reassess the field after a rainstorm. A clear plan is key; think of it as ensuring your numbers are as trustworthy as a seasoned accountant’s records.
On the flip side, pitfalls can arise when you miss the balance between supply and demand. Focusing too much on one rare trait might make you overlook how unique the NFT really is, like noticing only the cherry on top of a sundae. Misinterpreting how common a trait is, or ignoring updates that happen after minting (the process of creating an NFT), can make you undervalue an NFT. It’s similar to judging an entire painting by just one brushstroke and missing the full masterpiece. These frequent mistakes can trick your evaluation, possibly leading to pricing errors and strategy missteps in trading.
Integrating Rarity Scores into NFT Valuation Strategies
Rarity scores help set a fair price by showing how unique an NFT is within its collection. Imagine a group of 10,000 tokens where a 0.05% “Golden Crown” trait could make a token roughly 5 times more valuable than the base floor price. By mixing rarity scores with current floor prices and market trends, sellers can really see the true worth of their assets. This way, each NFT’s special traits get the spotlight they deserve, rather than getting lost in a sea of common prices.
Collectors and sellers lean on these scores to make smart moves in the marketplace. When they bid or set a listing price, they blend in the rarity score along with market trends and past sale data. In auctions, a higher rarity score can spark more competitive offers. In short, this method stops tokens from being undervalued based only on a collection’s average price, ensuring each valuation reflects its genuine uniqueness.
Final Words
In the action, this guide walked through measuring NFT uniqueness using several clear methods, each offering its own insight into trait evaluation and rarity metrics. A brief look at digital asset valuation and practical calculation tools helped clarify the process and highlighted key best practices along with common mistakes.
The detailed steps support building a smarter digital asset portfolio while keeping risk and demand in perspective. With this knowledge, you’re equipped to master how to calculate nft rarity and make positive investment decisions.
FAQ
How to calculate NFT rarity on OpenSea?
Calculating NFT rarity on OpenSea means you examine how common or unique each trait is within a collection. You may compute average trait percentages and use ranking methods to assess the overall rarity score.
How to calculate NFT rarity for free?
Calculating NFT rarity for free means you can use no-cost online tools like Rarity.tools and NFT Rarity Sniper that offer built-in formulas to gauge trait frequency and overall token uniqueness without charge.
What does NFT rarity ranking mean?
NFT rarity ranking means tokens are ordered by how unique their traits are. This approach uses methods like statistical rarity and trait ranking to compare each token within its collection side-by-side.
What is a rarity NFT marketplace?
A rarity NFT marketplace means a platform where tokens are sorted based on their rarity scores. This allows collectors to easily spot unique items and compare the distinct attributes of different tokens.
What are rarity tools for NFTs?
Rarity tools for NFTs mean online platforms that automatically compute scores using various formulas. They help both buyers and sellers assess token uniqueness by weighing trait frequency and statistical rarity.
How does OpenSea display NFT rarity information?
OpenSea displays NFT rarity information by showing token attributes and their frequency within the collection. This helps users form a baseline understanding while third-party tools offer deeper rarity analysis.
What are common NFT traits examples?
Common NFT traits examples include visual elements like background color, accessories, or special markings. These characteristics directly impact how a rarity score is calculated and compared to similar tokens.