Ever wonder if a stock chart can say more than the news headlines? When you look at how prices move and pay attention to trading volume (the number of shares bought and sold), you’re using technical analysis, a simple way to read the market’s pulse. Some traders spot repeating patterns that hint at what might come next. This approach works for everyone, whether you’re a seasoned expert or just starting out. In short, technical analysis gives you clear signals to help you make smart moves based on how prices naturally flow.
What is technical analysis in investment: Clear Insights

Technical analysis looks at how prices move and the trading volume instead of focusing on things like company sales or earnings. It works on the belief that every piece of public information is already built into an asset’s price. For example, if you see a sudden jump in a stock’s price, it means the market has already reacted to the news, even before most investors take notice. Did you know that once a trader noticed a sharp drop in trading volume and predicted a rebound? That moment showed how market signals can sometimes speak louder than the headlines.
There are three simple ideas behind this method. First, the market shows all public information in its price. Second, prices tend to follow a trend, whether that means going up, down, or moving sideways. And third, history tends to repeat itself, so similar patterns often appear over time. These ideas help traders spot trends that may be strong, weak, or neutral, making it easier to decide when to enter or exit a trade.
Both seasoned analysts and everyday investors use charts to see these trends. Some combine these insights with other research, while others trust only the charts and basic statistics. In short, technical analysis offers clear guidance with its focus on market signals and historical price data, giving everyone a smart toolset for navigating today’s fast-moving financial markets.
Key Tools and Indicators in Investment Technical Analysis
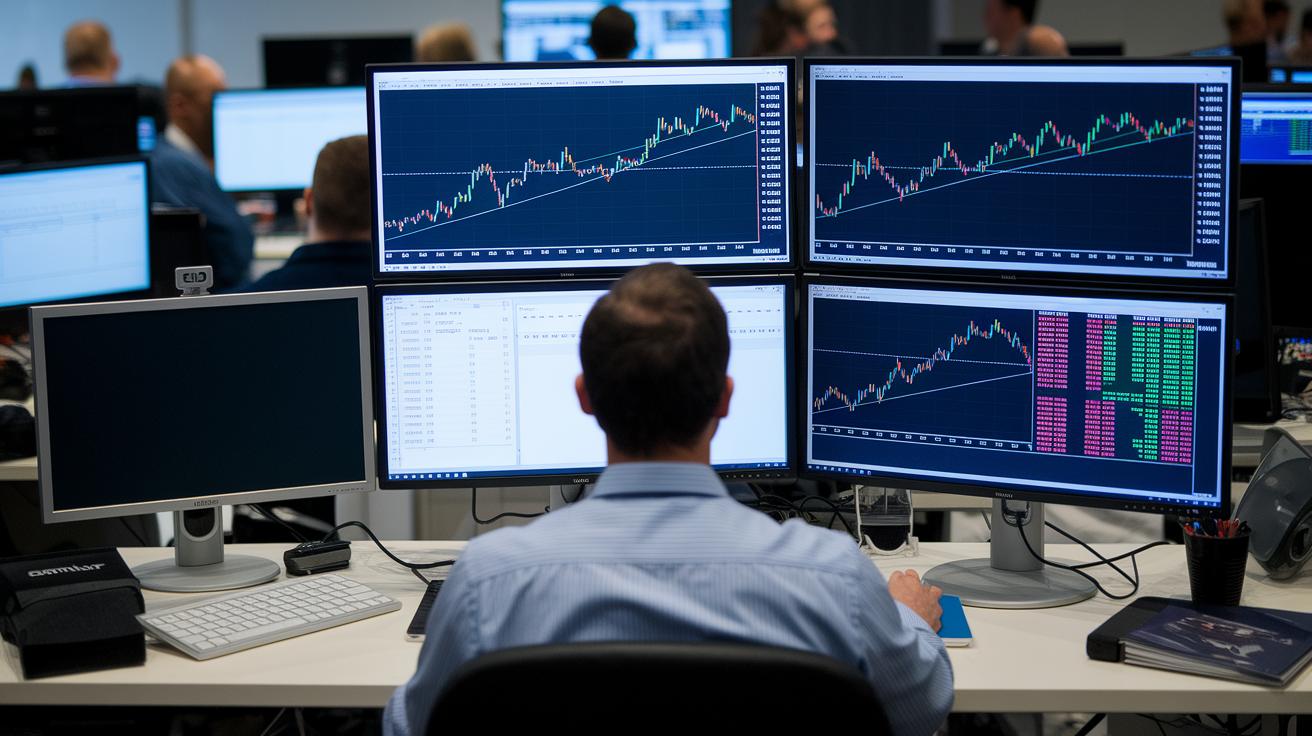
Technical analysts use handy tools to get a feel for the market's heartbeat. Moving averages, for instance, help smooth out the day-to-day ups and downs in prices so you can see the real trend. Think of it like averaging out the speed of cars on a road to tell if traffic is speeding up or slowing down. When that moving average line turns upward, it’s a clear sign that prices are steadily rising, almost like watching a train pick up speed.
The Relative Strength Index, or RSI (a gauge to see if an asset might be too expensive or too cheap), works much like checking a thermometer before you head out. Readings above 70 might signal that the asset is overbought, while lower numbers suggest it could be oversold. Ever notice how sometimes the market feels like it’s overheating? That’s when traders get a hint that it might be time to slow things down.
Another important tool is the MACD, which stands for Moving Average Convergence Divergence. This indicator compares different moving averages to spot shifts in momentum. It’s similar to noticing when your car suddenly speeds up or slows down. Oscillators, such as Stochastic, also help by measuring the strength of trends and hinting if a price move can keep its pace or may start to fade.
Volume analysis counts the number of shares traded, confirming whether a price change really has the muscle behind it. Meanwhile, Fibonacci retracement levels act like markers on a race track, pointing out potential spots where prices might pause or bounce back. Professional platforms tie all these tools together with features like stock screeners, heat maps, and real-time charts. This setup gives traders the insight they need to make smart, timely decisions.
Interpreting Price Trends and Patterns in Investment Technical Analysis
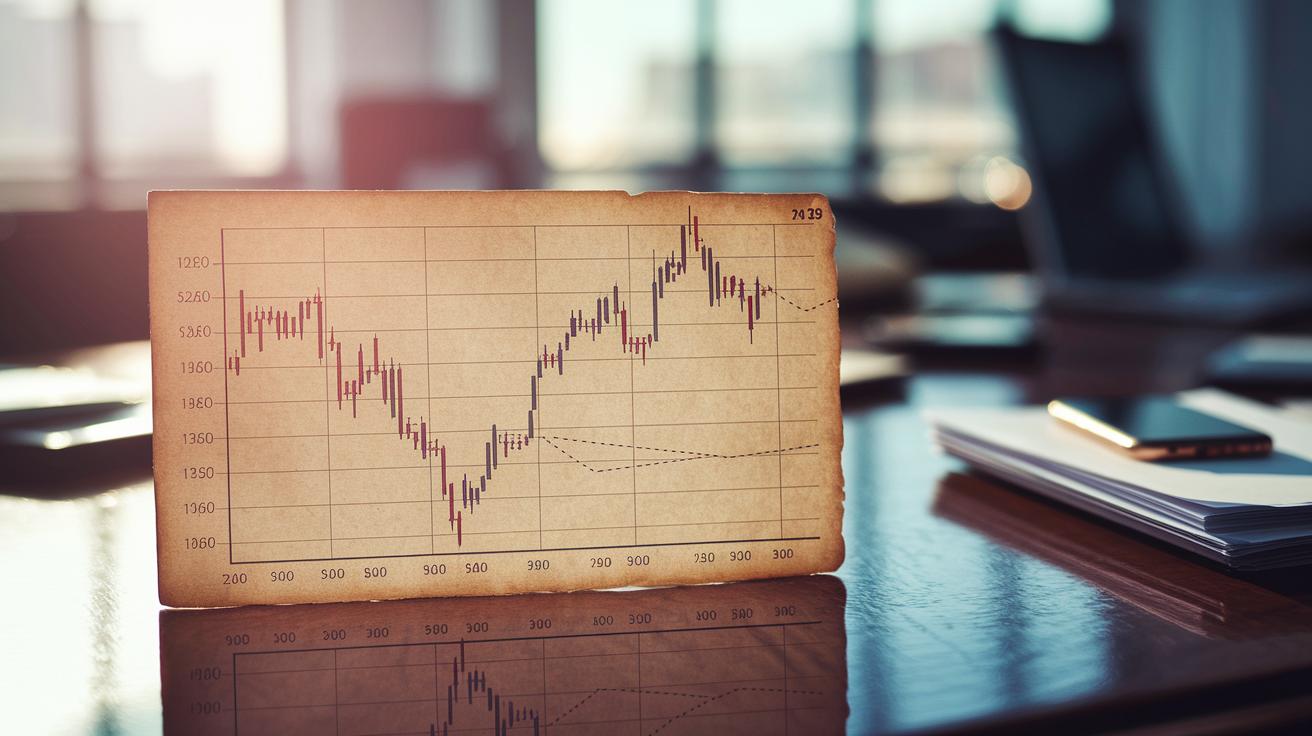
When you look at a chart, think of support levels like a floor that stops an asset from falling any further. It’s similar to an elevator that can’t go below a certain point. On the flip side, resistance levels act like a ceiling that holds back rising prices. Traders use these ideas to understand the market’s momentum and decide their next moves.
Drawing trend lines along the highs or lows is like sketching a path on a roller coaster. It shows whether prices are following a steady beat or if they’re shifting gears. This simple technique gives you a clear picture of the market’s direction and strength.
You’ll also notice familiar shapes on charts, such as head and shoulders, double tops and bottoms, triangles, or flags. For example, a head and shoulders pattern might indicate that a strong upward trend is slowing down, which can be a sign to review your position. Recognizing points where prices break past the usual support or resistance levels is crucial because these moments often signal a change in the market’s rhythm.
Altogether, these visual cues act like landmarks on a map, guiding traders as they plan their next steps in the market.
What Distinguishes Technical Analysis from Fundamental Analysis in Investment
Technical analysis uses price and volume data to read the market. It works on the idea that every public bit of information is already built into market prices. Think of it like checking a thermometer to know the temperature, everything you need is right there. Meanwhile, fundamental analysis looks deeper by studying a company's financial statements, earnings, and economic signs to find its real worth.
Technical methods are great for timing trades. They focus on finding trends, spotting patterns, and noticing shifts in market momentum. By studying charts, moving averages (which smooth out short-term price changes), and other signals, traders pick the best moments to buy or sell. This approach is handy for those aiming for short-term wins.
On the flip side, fundamental analysis examines a company’s inner workings, like its revenue and market conditions, to gauge long-term value rather than short bursts of price change. Many savvy investors mix both methods; they use technical cues to set entry and exit points and lean on fundamental analysis to confirm that their choices are built on solid ground.
Blending these approaches gives investors a more balanced view. It combines the quick signals of market moves with a deeper look at a company’s overall health. Check out more on these approaches at investment analysis techniques.
Benefits and Limitations of Technical Analysis in Investment

One big win with technical analysis is that it makes trend directions clear. It lets you see price patterns on charts and through indicators in a very visual way. For example, you might set a stop-loss level – which is a safety net that sells your asset if prices drop quickly – after noticing a trend reversal. It’s a bit like catching the perfect wave when timing is everything.
Another plus is that visual cues can guide when to exit a position. Think of it like watching your car’s dashboard alert you to slow down. Tools like moving averages (which help smooth out price data) and oscillators (indicators that show momentum) offer clues about whether the market is speeding up or slowing down. Methods that track price swings also help you tell calm market moments from more turbulent ones.
There are some downsides too. In choppy markets, you can get false signals that make trends look solid when they are not. Short-term price spikes might trick you into thinking there’s a clear trend instead of just random movement. Plus, technical analysis might miss sudden news events that shake up the market, and relying too much on past data might not capture the current scenario perfectly.
Many traders find that mixing technical methods with fundamental and sentiment analysis leads to a more balanced approach. This blend can help manage risk while giving you a fuller picture of market movements.
Practical Case Studies of Technical Analysis in Investment

Back in 2023, gold prices soared past $3,500 an ounce, marking almost a 30% rise for the year. Analysts picked up a strong sign when they noticed that the 50-day and 200-day moving averages had crossed in a bullish pattern. This crossover hinted that gold mining stocks were set to climb, especially with hints that the Fed might soon cut rates. It was a clear sign that many traders were positioning themselves ahead of big economic shifts.
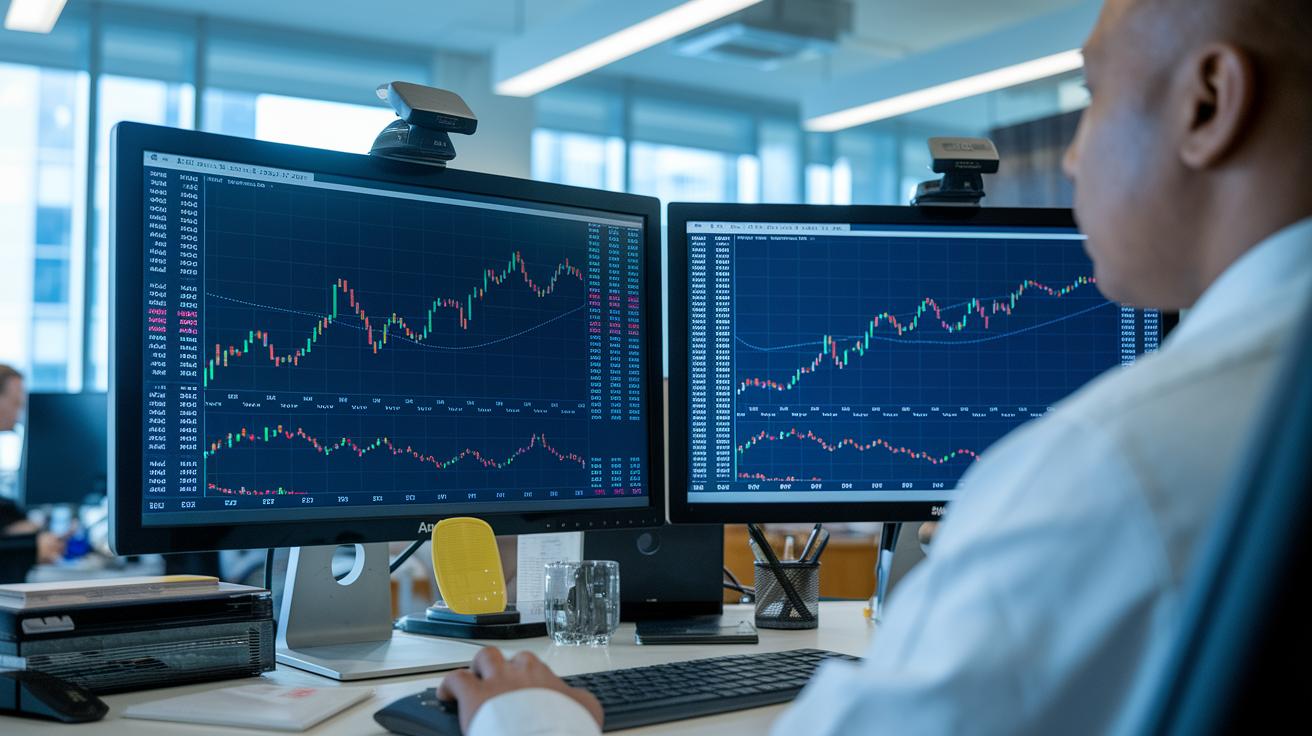
In another example, the S&P 500 technology sector experienced what experts call a volume-backed breakout. Essentially, the price broke above a long-standing resistance line, an indicator that the market might be starting a new upward trend. And the high trading volume confirmed that plenty of investors were jumping in, making it easier to spot the right moment for a trade.
Today, modern trading platforms put these kinds of insights at everyone’s fingertips. Traders can use real-time charting tools that mix historical price data with instant trading signals. Plus, many platforms include integrated API access, so when a moving average crossover happens, orders can be placed in seconds. Imagine watching that signal light up and acting on it almost immediately, this is technical analysis working in real time.
Looking at these cases, it’s clear that combining volume tracking with pattern spotting reveals market trends early. Tools like moving averages, breakouts, and resistance levels all come together to show how the market behaves, which helps traders make smart, timely decisions even when the market seems complicated.
Final Words
In the action, we explored how technical analysis uses price and volume data to shed light on market behavior. The post broke down essential methods like moving averages, candlestick charts, and support and resistance levels. It also compared these techniques with traditional financial reviews and reviewed practical case studies that highlighted real market signals.
Understanding what is technical analysis in investment can help shape smarter, diversified strategies. Keep building on these insights as you walk the path to a stronger digital asset portfolio.
FAQ
What is technical analysis in investment and trading?
The concept of technical analysis in investment and trading means studying price movements and volume using charts. It works on the idea that market prices already reflect all available information.
What is an example of technical analysis?
An example of technical analysis is examining chart patterns like support and resistance along with indicators such as moving averages and RSI to signal potential trends and trading opportunities.
Where can I find a technical analysis PDF for stocks?
A technical analysis PDF for stocks usually offers a detailed overview of methods, charts, case studies, and indicators used by traders to evaluate stock price movements.
How does technical analysis differ from fundamental analysis?
The difference is that technical analysis focuses solely on price and volume data, while fundamental analysis reviews financial statements and economic factors to assess a company’s value over time.
What are some common technical analysis methods?
Common technical analysis methods include using moving averages, RSI, MACD, Fibonacci retracements, trend lines, and volume studies to provide insights into future price trends.
What is the 7% rule in stocks?
The 7% rule in stocks is a guideline many traders use, aiming for a 7% gain or loss threshold to manage risk during trades, although practices can differ from one trader to another.
What are the three rules of technical analysis?
The three rules of technical analysis are: the market discounts everything, prices tend to move in trends, and history often repeats itself through recurring chart patterns.