
Ever wonder what really drives the market, not just the numbers? Think of market sentiment like a thermometer that shows how investors are feeling. It tells us if hope is lifting prices or if caution is holding them down. Sometimes emotions push prices to move before the facts come through. Knowing this mood can help you make smarter choices and feel more secure about your decisions. In short, keeping an eye on investor feelings is key to steering through today’s fast-changing market.
Defining Market Sentiment: Core Definition and Importance
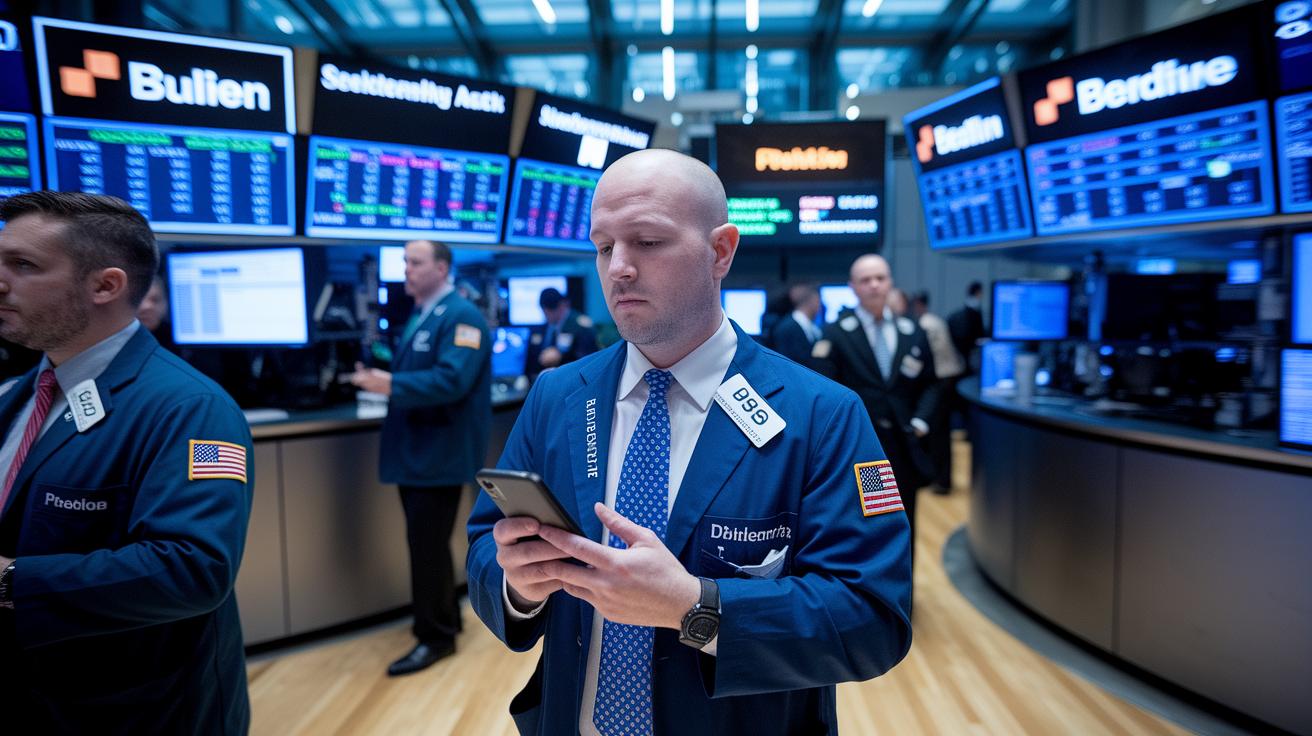
Market sentiment is like the mood of investors. It shows if most traders are feeling upbeat (bullish, meaning they expect prices to rise) or down (bearish, meaning they expect prices to fall). It’s different from fundamental analysis, which looks at things like a company’s earnings, or technical analysis, which studies price charts. Instead, sentiment analysis focuses on how everyone feels about a market, almost like a mood ring that tells the emotional temperature of the scene.
Sometimes feelings push prices more than the raw numbers. For instance, when investors get excited by good news, prices can go up simply because optimism takes over. Imagine investors reacting to a surprising earnings report by buying stocks enthusiastically, even if the long-term facts remain steady. This example shows that market moves often depend on human reactions and immediate emotions.
Understanding market sentiment is key to timing trades and managing risk. By noticing whether the mood is overly cheerful or too cautious, traders can decide the right moments to change their positions. In short, blending a clear read of data with a feel for the investor mood helps make smarter, more balanced decisions.
Key Market Sentiment Indicators and Measurement Techniques
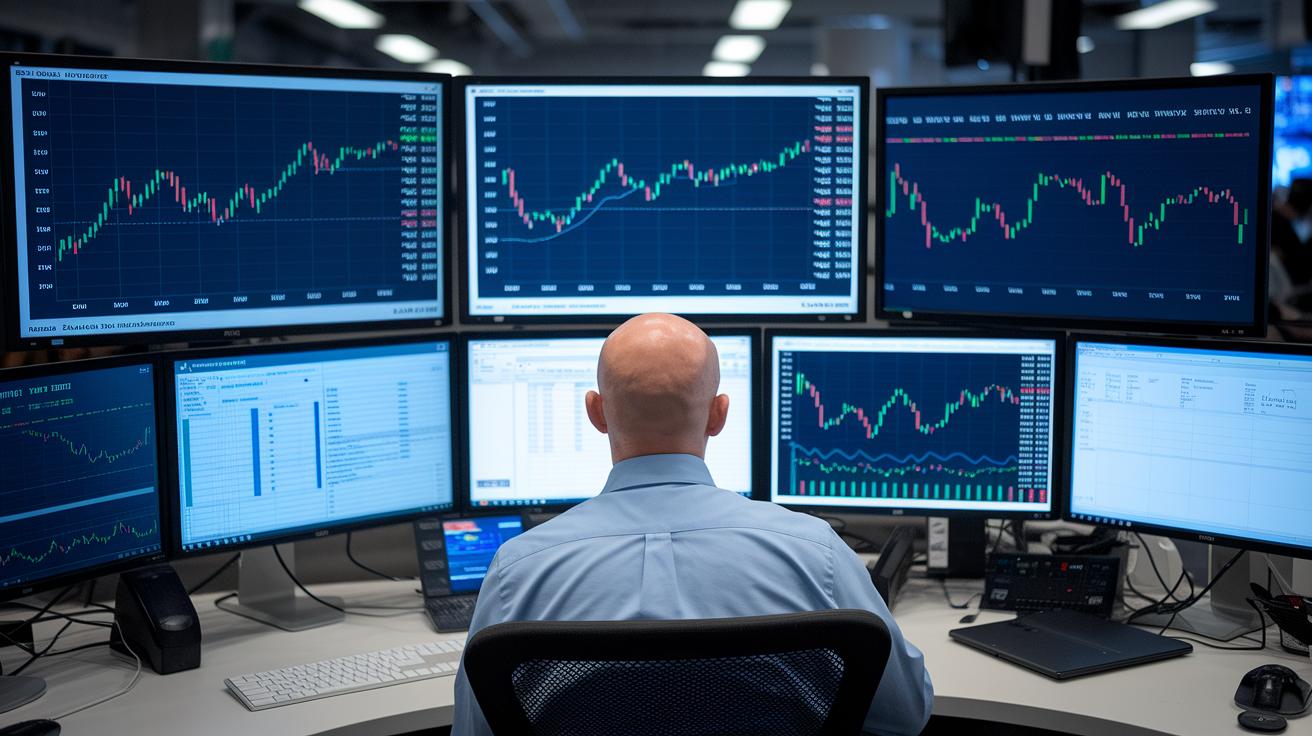
When it comes to understanding the market’s mood, numbers can tell a powerful story. Metrics offer a clear way to gauge how traders are feeling beyond ordinary charts and data. They work hand in hand with other tools, like investment analysis techniques, to let investors know when the market is buzzing with energy or moving with caution.
VIX Volatility Index
The VIX is often known as the fear gauge. It shows the market’s expected 30-day volatility, that is, how much prices might jump around in the next month. A reading under 15 usually means a calm, steady environment that might favor a bullish trend. On the other hand, a number above 25 suggests traders are nervous, which could mean selling is about to pick up. This indicator pulls its data from options on major indices and updates continuously throughout the trading day.
Bullish Percent Ratio
This ratio tells us what percent of stocks are flashing buy signals. If it climbs above 70%, it might mean the market is getting overbought, so caution could be wise. Often, historical extremes in this ratio are used to predict when the market might turn, helping investors decide when to be extra careful.
Commitment of Traders Report (COT)
Published every Friday, the COT report breaks down the long and short positions held by both commercial players and large speculators, based on data from the previous Tuesday. This detailed snapshot lets investors see which groups are driving the market’s sentiment, giving a clearer picture of where the overall energy stands.
AAII Investor Sentiment Survey
This weekly survey gathers insights from about 1,000 retail investors, splitting their views into bullish and bearish camps. It offers a quick, straightforward look at how everyday traders are feeling about current market conditions, serving as another useful gauge of market sentiment.
Open Interest in Futures
Open interest measures the number of futures contracts that are still active and not settled. When you see this number rising along with prices, it can reinforce the current trend, suggesting strong momentum in the market. In contrast, a drop in open interest might mean that the trend is losing steam or could even be heading for a reversal.
Bullish versus Bearish Outlook in Market Sentiment
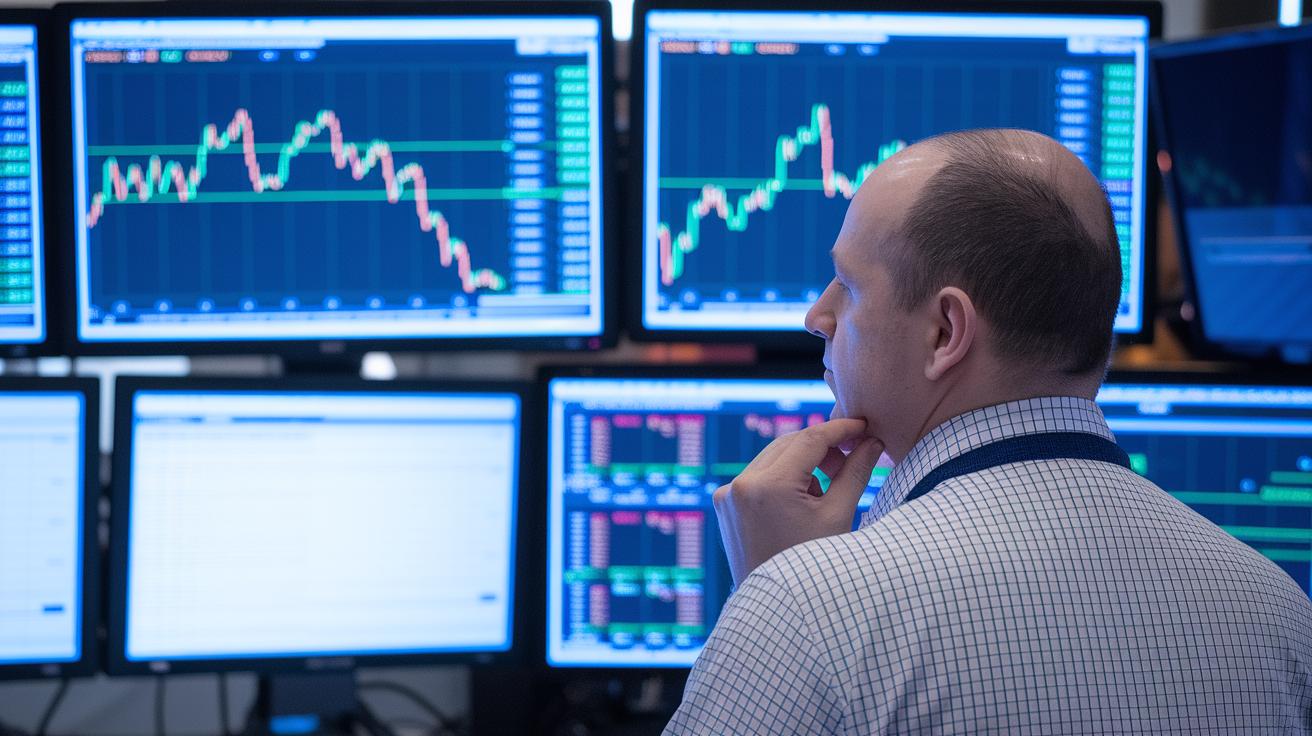
Market sentiment moves like the tide, showing us the overall mood of investors. Sometimes, a burst of optimism sends prices soaring as traders jump in. Other times, a wave of caution hits, and people start selling off their positions. When sentiment numbers hit very high or very low spots, it might be a hint that the market could turn soon.
Bullish Outlook
When the mood is bullish, investors feel upbeat and expect prices to rise. This often happens when measures like the AAII bulls go above 60% or the Bullish Percent Ratio tops 70%. Imagine a bright, sunny day that lifts everyone’s spirits, that's the market when it's running strong with confidence. Even if the underlying reasons haven’t changed much, that positive vibe can keep buyers coming in and push prices up.
Bearish Outlook
On the flip side, a bearish outlook signals caution in the market. For instance, when a fear gauge like the VIX jumps above 25, it tells us that uncertainty is building among traders. Think of it like a gray, overcast sky warning you of a coming storm. In these situations, investors tend to sell quickly, expecting a drop in prices. This cautious mood can add extra pressure on the market, urging everyone to rethink their positions.
Overall, when sentiment readings are extremely high or low, they act as early warning signs. It’s a good idea for investors to take a moment and review their strategies before the market mood shifts again.
Behavioral Finance Research in Market Sentiment

Academic studies show that investor moods change much like the seasons. Research tells us that when fear spikes – measured with tools like anxiety indexes (a simple gauge of nervousness) – markets tend to dip, while waves of confidence usually appear when optimism fills the air. Imagine the market shifting quickly like a sudden change from a stormy sky to clear, bright weather. In short, the overall mood of investors can hint at upcoming turning points.
Anxiety and risk ratings give us a clear look at how feelings drive market moves. Studies that count up nervousness and risk avoidance can often warn of a coming rush to buy or sell. When these numbers start to tip one way or the other, they guide traders on whether it might be time to jump in or pull back. It’s almost like watching a tug-of-war between greed and fear.
Even number-based models, like sentiment-volatility correlations (a way to link investor mood with price ups and downs), prove that how investors feel is a powerful signal. Tools and research from areas like behavioral economics (which looks at how people make financial choices) give traders an extra edge by adding an emotional layer to market analysis. This blend of clear numbers and human feelings helps them make smarter, more informed decisions.
Incorporating Market Sentiment into Investment Strategies

Adding market sentiment to your investment approach is like giving your strategy a real pulse check. Instead of just crunching numbers, you feel the room's mood. It tells you when traders are buzzing with excitement or when they're holding back with caution. This kind of insight, combined with technical analysis, can help you time your moves better, manage risks wisely, and catch chances that might otherwise slip by unnoticed.
Imagine it like this: you use sentiment indicators such as the VIX or the AAII survey every day, then mix that with classic technical patterns like support and resistance levels. You might even adjust your position sizes later when sentiment reaches extreme levels. Overlaying sentiment trend charts with price action is like spotting a fork in the road before the crowd follows.
- Monitor key sentiment indicators (VIX, AAII survey) daily.
- Combine sentiment readings with technical patterns such as support and resistance.
- Scale position size in a contrarian manner at extreme sentiment levels.
- Overlay sentiment trend charts with price action to spot divergence clues.
Staying ahead means watching how the market’s mood shifts over time. Instead of sticking to one fixed strategy, you adjust your portfolio as new sentiment information comes in. If you see strong technical signals but notice investor confidence waver, it might be time to reconsider your positions. This flexible, dynamic approach is much like following a well-thought-out investment decision-making process that evolves with the market. Keeping your strategy adaptable and continuously monitoring sentiment will help you respond smartly during fast market moves, leading to better timing and a more secure portfolio.
Final Words
In the action, this blog unpacked investor moods and broke down key methods to gauge market feelings. It touched on popular metrics like the VIX and the Bullish Percent Ratio and even looked at behavioral finance studies.
We saw how blending these measurements with traditional techniques brings clarity to investment moves. Taking small steps, like reading sentiment numbers alongside price trends, can boost your portfolio decisions. Remember, understanding what is market sentiment offers a clear view of the market pulse and sets the stage for confident, thoughtful moves ahead.
FAQ
What does market sentiment mean in the stock market?
The definition of market sentiment is the overall mood of investors in the stock market. It reflects a general push towards optimism (bullish) or pessimism (bearish) that influences stock prices.
Can you give an example of market sentiment?
An example of market sentiment is a strong rally fueled by positive news or a rapid decline when investors suddenly become fearful, turning optimism into caution.
What are market sentiment indicators, and is there a TradingView version?
Market sentiment indicators measure investor mood with tools like the VIX. TradingView features similar signals, helping traders spot when market feelings shift toward bullish or bearish extremes.
Is there a formula to measure market sentiment?
While there isn’t one fixed formula, many models combine factors like price movement and trading volume to create signals that capture investor mood and potential market trends.
How do you identify market sentiment?
Identifying market sentiment means looking at key signals—such as technical indicators, news trends, and investor surveys—that point to whether investors lean toward optimism or caution.
Why can market sentiment turn negative?
Market sentiment can turn negative when disappointing data, rising volatility, or adverse news causes investor fear, leading to a shift from optimism to widespread caution.
How can I trade using market sentiment?
Trading with market sentiment involves adjusting strategies based on investor mood; for example, taking contrarian positions when sentiment is overly negative or overly positive to capture market shifts.
What is a synonym for market sentiment?
A synonym for market sentiment is investor mood. This term encapsulates the collective feelings and outlook that market participants have about market conditions.
