
Have you ever thought that tiny changes in orders could lead to big swings in crypto prices? Imagine watching ripples on a pond with every buy or sell order, a real-time peek at where the pressure points lie.
By keeping a close eye on the live order book, traders can see hints of where prices might go next and plan smart moves with confidence. In short, this guide will show you how to uncover hidden trends, predict shifts, and control risk with a simple, yet powerful look beneath the surface.
Assessing Crypto Market Depth: Real-Time Order Book Liquidity

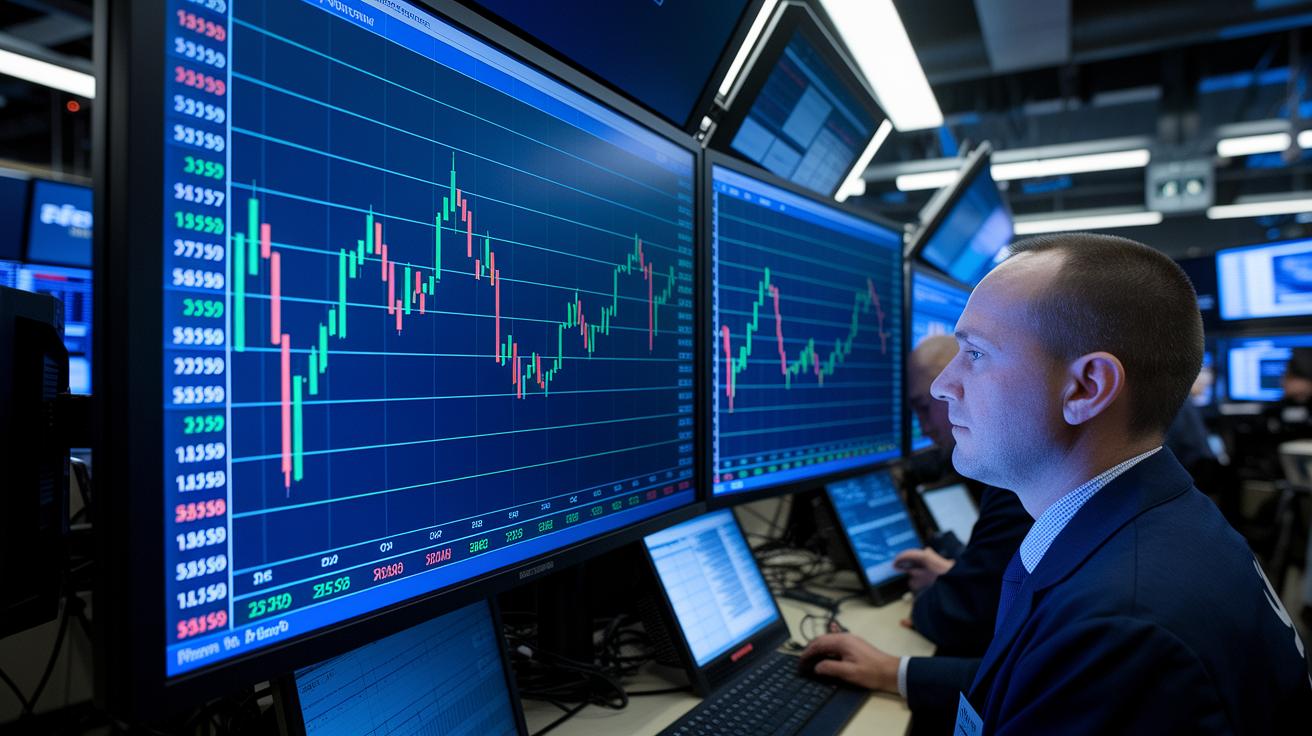
Market depth gives you a live look at all the buy and sell orders waiting at different price levels. It shows the number of orders that haven't been filled yet in the ever-changing world of the cryptocurrency market (a digital space where crypto is traded). An order book helps traders know where buyers and sellers are positioned, which in turn reveals how supply and demand are driving price changes.
Some key numbers to watch include:
- How many orders sit at the top three price levels
- Total trading volume within each price group
- The size gap between the best buying and selling prices
- How quickly orders are coming in each second
- How order sizes vary across different price tiers
These details are important because they paint a clear picture of market strength and show how smoothly large trades can be made. For instance, a deeply populated order book means even big orders might move the price only a little, while a thin book can lead to quick price swings when orders are filled.
In short, knowing these measures is crucial. When traders look at order book depth and related numbers, they can tell how fast their orders might go through and predict potential price moves. This smart analysis is one of the market study techniques that helps investors plan trades and handle the risks that come with a fluctuating market.
Visualizing Crypto Market Depth Analysis with Bid-Ask Charts
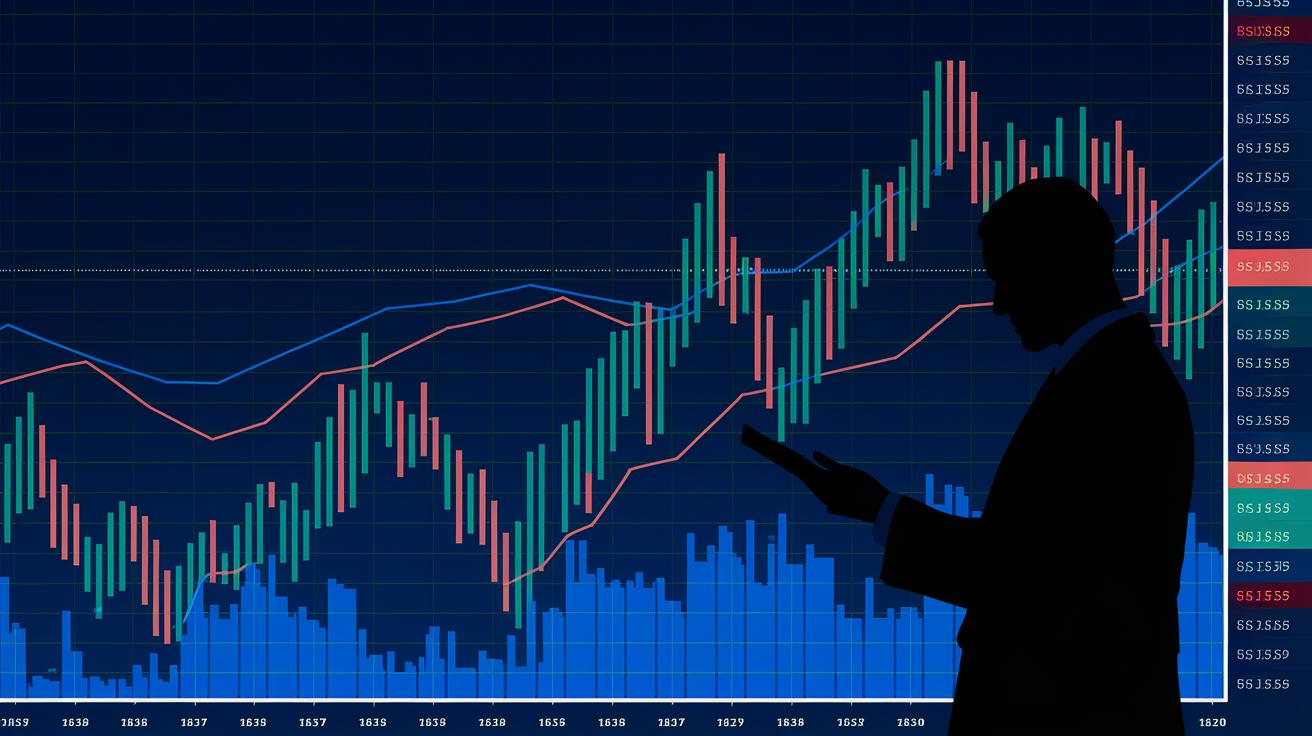
Bid-ask depth charts let you quickly see how buyers and sellers line up at different prices. They display two curves that show the total orders at each price level. The horizontal axis marks the prices, while the vertical axis shows the order amounts waiting to be filled. A trader might check this chart to spot where big clusters of orders hint at support or resistance.
- Price axis labeling
- Volume axis scaling
- Bid-side curve
- Ask-side curve
- Mid-market price marker
Looking at these elements helps you notice shifts in market mood. The price axis clearly indicates where orders are set, and the volume scaling shows you just how heavy the order groups are. The bid-side and ask-side curves map out the balance between buyers and sellers, while the mid-market price marker highlights the trade focus at that moment. This clear snapshot can guide you on the best times to enter or exit trades by showing where strong order clusters create natural support or resistance.
Analyzing Liquidity Trends and Slippage Impact in Crypto Market Depth
Picture a market with very few orders, like a narrow bridge that sways even with a light load. When there aren’t enough orders at key price points, a big trade can nudge prices far off their usual track. This situation makes the market feel unpredictable, as tiny trades can cause big, sudden moves.
Now, think about what happens when trading volume suddenly spikes. A flood of trades can disturb the balance between buyers and sellers almost instantly. One moment the order book is stable, and the next, certain prices see a quick surge or drop. It’s like watching a seesaw of numbers; one swing can leave traders scrambling to adjust their plans. High trading volume may temporarily boost liquidity (meaning cash-like ease), but it might just as quickly lead to a slowdown, causing unwelcome price jumps.
These everyday shifts remind us why keeping an eye on both order spreads and sudden volume changes is key. Understanding how thin markets can amplify slippage and noticing how rapid volume shifts unsettle prices helps traders size their moves better and manage risks with greater care.
Exploring Limit Order Dynamics and Price Level Clustering
Limit order clusters reveal spots where many unfilled orders gather at important prices, giving you a peek at market mood. Big bid or ask walls can act as temporary support or resistance, holding prices in check. When institutional orders add weight and cluster up, they mark places where traders might set their stop-loss orders or aim for targets. This insight can really guide smart choices when dealing with a choppy market.
- Map out the order clusters by their price.
- Check how thick the walls are compared to the average market price.
- Figure out the support and resistance levels.
Using these simple steps, you can tell if a price level is strong or a bit shaky. When clusters come together tight and the walls stand out well, it shows both buyers and sellers are ready to step in. This kind of insight is super useful for planning exact entry and exit points, letting you handle risks better while timing your trades perfectly.
Integrating Algorithmic Signal Detection in Crypto Market Depth Analysis
Algorithmic models keep an eye on order books all the time, picking up signals that might slip past the naked eye. High-frequency traders use these models to catch real-time price details from many exchanges. They look for easy-to-spot patterns like small hints of spoofing (tricks where fake orders are placed to fool the market) or quick changes in market depth. Even a small move of about 1.5% between two exchanges can set off a chain of automatic buys and sells. This method borrows ideas from technical analysis, where algorithms help find the perfect moment to trade, cut down on human mistakes, and speed up decision-making.
To put this into practice, here’s a simple step-by-step guide:
-
Record high-resolution snapshots of the order book
Keep a detailed log of every bid and ask so nothing gets missed. -
Calculate real-time depth imbalance ratios
Examine these snapshots to see the differences between buy and sell orders at various price points. -
Use threshold-based filters for anomalies
Set up filters that flag unusual moves that go past set limits, which might signal spoofing or a fast change in liquidity. -
Run cross-exchange arbitrage orders
Act on these imbalances by automatically placing orders across different exchanges to grab quick opportunities.
Regular monitoring is key. Always check how your model is doing by backtesting it with historical data. This mix of real-time data and multi-exchange analysis doesn’t just catch brief market signals, it builds trust in your trading strategy. Keeping a close eye on performance and tweaking the approach based on past results creates a strong habit of improvement. Integrating these algorithmic signals into your trading system can sharpen when you enter and exit trades and help manage risks better in the fast-moving world of crypto market depth.
Forecasting Liquidity Shifts and Sentiment with Advanced Crypto Market Depth Models

Advanced crypto market depth models help predict changes in liquidity (how easily something can be turned into cash) and trader sentiment. They keep an eye on things like big trades, news buzz, and even misleading signals from fake order placements. By watching these clues, traders can see when support might break or resistance may fall short.
These models also look at flow patterns between exchanges to hint at upcoming price changes. With these real-time insights, traders get early warnings about market shifts, so they can adjust their trading plans before things change too quickly.
| Factor | Impact | Monitoring Tool |
|---|---|---|
| Large trades | Quick drains on liquidity | Real-time order book snapshot |
| News events | Sharp spikes in depth volatility | Session anomaly alerts |
| Spoofing layers | Fake support or resistance levels | Order cancellation tracker |
| Cross-exchange volume | Signals for arbitrage chances | Multi-exchange feed |
Using these forecasts in a trading strategy means letting model outputs guide the timing of your entries and exits. When the data hints at a liquidity shift, traders can change their trade sizes or hold off until the market calms down. This method helps guard against sudden price changes while also letting traders catch clear, directional moves. By lining up their strategy with real-time signals, traders can manage risk and grab opportunities with more confidence.
Final Words
In the action, this article broke down crypto market depth analysis by explaining order book liquidity, bid-ask visuals, and practical risk metrics. It outlined clear steps on reading clustering, interpreting algorithmic signals, and assessing liquidity shifts. The guide uses bullet points and numbered steps to show how these details can shape smart and secure digital investment choices. With a focus on supply, demand, and risk management, investors can feel more confident about building a strong digital asset portfolio and staying ahead with actionable insights.
FAQ
What does crypto market depth analysis mean?
Crypto market depth analysis means studying all pending buy and sell orders across various prices in real time. This gives traders a snapshot of supply and demand dynamics for better planning.
How can I access different crypto market depth analysis formats like Reddit discussions, PDFs, and charts?
Various sources offer crypto market depth analysis. Reddit threads provide community insights, PDFs deliver detailed guides, and charts illustrate order book data to help you understand liquidity trends.
Where can I view a live crypto order book and get free order book data?
A live crypto order book displays real-time buy and sell orders. Many exchanges and online platforms offer free access to this data, making it easier for you to track market liquidity as it happens.
How does the Bitcoin order book on TradingView assist traders?
The Bitcoin order book on TradingView presents a live, visual format of market orders. This easy-to-read chart helps traders quickly assess liquidity and understand potential price shifts.
What is the market depth of cryptocurrency?
The market depth of cryptocurrency shows the number and size of pending orders at different price levels. It provides insight into overall liquidity, which helps traders gauge the trading environment.
What is the 1% rule in crypto?
The 1% rule in crypto indicates that trades exceeding 1% of total order volume can shift market prices noticeably. This guideline acts as a quick check on how sensitive a market might be to large orders.
How do traders best analyze market depth?
Traders analyze market depth by looking at key liquidity indicators like the bid-ask spread, volume distribution across top levels, and overall order flow. These metrics assist in gauging execution impact and risk.