
Ever feel like your trading plan might be missing that extra spark? Picking the right technical analysis software is like having a trusted mentor who breaks down complex charts and real-time data into everyday language. It turns a jumble of numbers into clear insights that help you make better calls.
In this post, we'll dive into some smart, easy-to-read tools that mix clear visuals with handy features for spotting trends and staying on top of risks. Think of it as giving your trading approach a little extra precision so you can catch market opportunities as they arise.
technical analysis software: Elevate Trading Precision
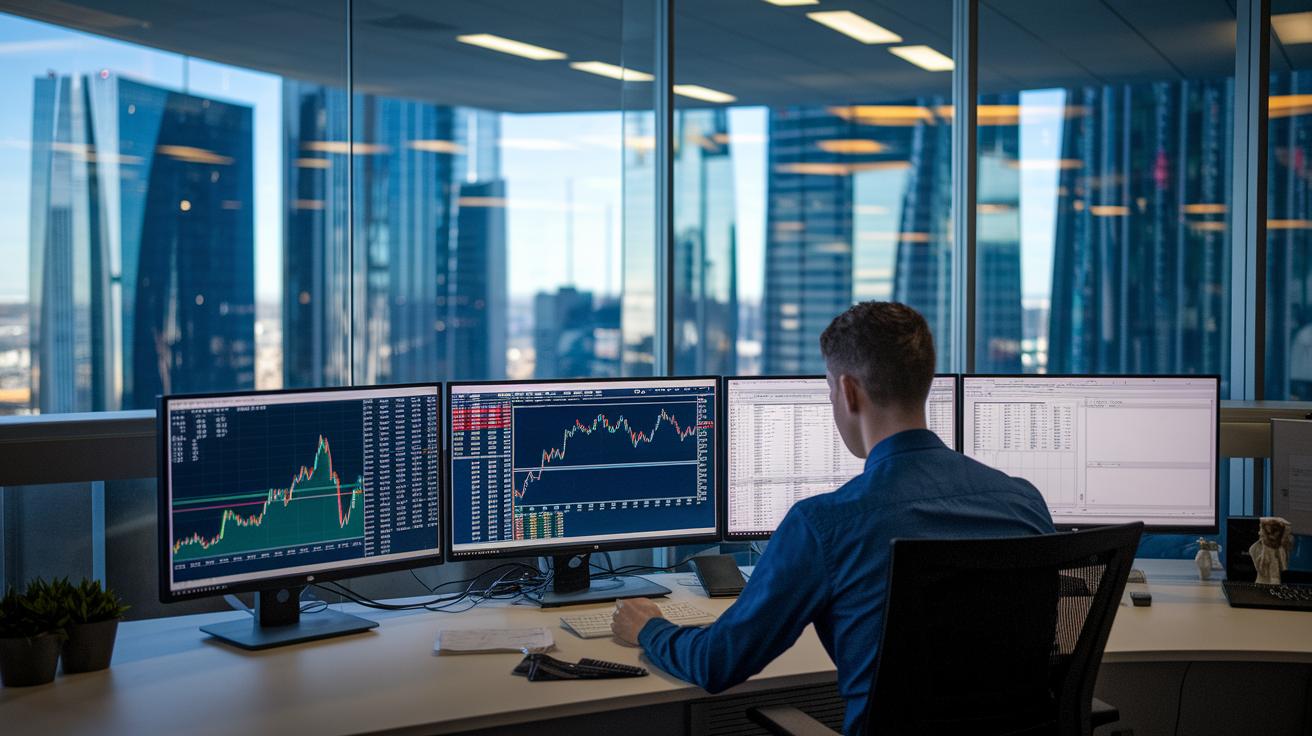
Picking the right technical analysis software can really boost your trading game. It’s like having a trusted friend who helps you read market trends and make smart decisions in a fast-moving world. The best platforms mix clear, easy-to-read charts with up-to-date data and robust tools, letting you check past price moves, guess future trends, and know when to buy, hold, or sell. If you're curious, check out "What is Technical Analysis in Investment" for more details.
Maybe you already lean on a top trading chart platform or a reliable crypto charting tool. No matter what you use, matching your strategy with the right program is essential for spotting opportunities and keeping risks in check.
| Software | Best for | Price Tier | Core Features |
|---|---|---|---|
| eSignal One | Professional traders | Premium | Advanced charting, real-time data feeds, customizable workspaces |
| TC2000 | Traders seeking integrated brokerage trading | Mid-range | Powerful charting, proprietary screeners, integrated trading |
| Thinkorswim | Both beginners and experienced users | Standard/Freemium options | Customizable technical charts, live trading, demo environment |
| MetaStock | Multi-asset analysis enthusiasts | Higher | Robust charting tools for stocks, futures, options, forex, fixed income, and commodities |
| TrendSpider | Users relying on automated analysis | Subscription-based | Algorithmic trendline detection and automated analysis across equities, crypto, and forex |
Each platform has its own strengths for different trading styles. For instance, TC2000 and Thinkorswim are great if you like making trades directly and testing strategies in a demo setup, while MetaStock works well for those who want to analyze a variety of investment types. And if you need quick, precise signals, eSignal One really stands out with its speedy charts and real-time insights. It’s no wonder many professional traders choose it to keep up with the pulse of the market.
Essential Features of Technical Analysis Software

Technical analysis software helps you see the market clearly while giving you handy tools to make trading decisions easier. It combines different chart types like candlestick, bar, line, and Heikin-Ashi with drawing tools such as trendlines and Fibonacci retracements (which help spot potential turning points). This means traders at any level can easily pick out trends and patterns. Plus, these programs feature a range of indicators like moving averages (the average price over time), RSI (a measure of market speed and change), MACD (a tool to track trend momentum), Bollinger Bands (which show market volatility), and volume oscillators to help you feel the pulse of the market.
- Multiple chart types paired with drawing tools for clear trend analysis
- A broad library of indicators for understanding market conditions
- Strategy backtesting modules via Backtesting Software to test ideas on past data
- Real-time alerts for crossovers, breakouts, and custom conditions
- Automated pattern recognition for setups like head-and-shoulders, flags, and triangles
- A live signal generation system to catch market moves as they happen
- Customizable alerts that fit your unique trading style
These features make it simple to read market trends and act on them with confidence. With tools to test your strategies and get instant updates, you can reduce guesswork and seize opportunities as they arrive. In short, blending visual analysis, live data, and personal alerts sharpens your trading decisions every time.
Usability and Interface in Technical Analysis Software

Traders today want to use their platforms easily whether they're at home, in the office, or on the go. Modern technical analysis software helps sync your settings in the cloud, so the same clear layout follows you from your desktop to your tablet or phone. Picture checking your charts during a break and seeing that same friendly interface on your device.
The secret is a design that feels natural. With drag-and-drop tools, you can add trendlines, notes, and even Fibonacci setups (Fibonacci setups are guides based on a sequence of numbers that hint at potential market movements) without hassle. It’s like having a personal helper who makes sure your favorite indicators are always arranged just how you like them.
Custom workspaces bring even more ease. You can save your chart tabs, use set layout templates, and even prepare for multi-monitor viewing if needed. Plus, with options for light or dark modes and quick view switches, you can set up your workspace to be as comfortable and efficient as possible at any time.
Pricing Models and Licensing for Technical Analysis Software

Traders have a couple of ways to pay for technical analysis software. One simple option is the subscription plan. You might start at just $14.95 a month for basic tools, while more advanced packages can cost up to $199 monthly. With subscriptions, you get regular updates and new features that help you stay on top of market trends. On the other hand, perpetual licenses mean you make a one-time payment, like MetaStock’s core bundle at $169. This is a great fit if you’d rather pay once than deal with ongoing fees.
Freemium models are also popular. They let you use basic charting features without paying anything at the start, so you can get a feel for the platform. But if you need advanced tools, you’ll eventually need to upgrade to a paid plan. This option works well for beginners or casual users who don’t require a full range of analysis tools right away.
Many platforms also offer trial periods ranging from 7 to 30 days. This lets you test the software without any financial risk and see if it matches your trading style. With all these choices, it really comes down to what fits your personal trading needs and how deep you want your analysis to be.
System Requirements and Integration in Technical Analysis Software

When you start using technical analysis software, it's important to make sure your computer or device is ready for the job. For desktop users, the software works best on Windows 10 (or later) and macOS 10.14 (or later). If you prefer using a mobile device, you'll need iOS 12 or Android 12 or above. Even if you’re working through your web browser, apps like Chrome, Firefox, or Edge have you covered. A good rule of thumb? Your computer should have at least 8 GB of RAM, a dual-core processor, and 2 GB of free disk space. Think of it like building a stable base before putting up the walls of your trading strategy.
Integration is just as key. Many platforms let you connect live broker accounts using special API keys and plugins. (An API key is simply a code that lets different software talk securely.) This means you can get real-time market updates and make sure your data is always current. Plus, you can check your charts and data from your desktop, tablet, or mobile with ease. In short, connecting your trading software with your brokerage account becomes a smooth process, linking data analysis directly to trade execution in a way that feels almost effortless.
Support, Community, and Learning Resources for Technical Analysis Software

Official support channels give traders great, hands-on help through easy-to-follow guides and video tutorials that break down everything from setting up charts to using key indicators (tools that help you track market trends). You can chat live or send an email for support, with different levels of service based on your subscription. For instance, one video might show you step-by-step how to adjust a moving average indicator, making it a lot less daunting.
Active community forums are a friendly place where traders swap tips, ask questions, and share market ideas. Many platforms host these busy forums where thousands of traders exchange real-time insights. This open, informal setting helps you feel supported whether you're just getting started or have been in the game for years.
Structured learning paths add to your trading know-how with regular webinars and on-demand training sessions focused on building solid strategies and setting up your tools. Clear chart tutorials walk you through using various features, and some platforms even offer extra market mood insights to give you an added edge.
Setting Up and Mastering Technical Analysis Software

Begin by downloading the installer or using the online client, then log in with your license or the free tier. Once you're in, load your past data and pick the timeframes that best match your trading style, whether that's daily, intraday, or weekly. Set up your favorite indicator sets and chart templates to kick off your analysis. Picture it like launching a simulation trading session with all your favorite tools ready to go.
Now, turn your attention to creating custom signal notifications. Choose the alert criteria you need, such as moving-average crossovers (which are guides to help indicate trend changes), price thresholds, or pattern matches. Think of it as setting up a personal assistant that lets you know exactly when the market hits a key point. These alerts help you react quickly when market signals shift, giving you that extra boost of confidence in your decisions.
Finally, boost your trading workflow by running the built-in strategy optimizer to test and fine-tune your setups. Export performance reports that show how your strategies performed over your chosen historical period. This process turns raw data into an easy-to-understand reflection of your trading style, letting you adjust your settings and simulate future moves in a controlled way. Imagine reviewing a detailed report and refining your alerts to catch new patterns as they emerge.
Final Words
In the action, this article took a hands-on look at top trading chart platforms and essential capabilities from chart types to API connectivity. It broke down best technical analysis tools, from usability and pricing models to system requirements and community support.
The guide showed how to set up your technical analysis software for efficient, informed investing. The detailed yet accessible insights leave you better equipped to tackle market trends with confidence.
FAQ
What is technical analysis software?
The term technical analysis software refers to programs that help traders study price charts, apply indicators like moving averages and RSI, and detect patterns to guide trading decisions. Learn more in our guide on Technical Analysis in Investment.
What is the best tool for technical analysis?
The best tool for technical analysis depends on your needs, but platforms like eSignal One, TC2000, and Thinkorswim offer strong charting, live data, and customizable features for diverse trading strategies.
Can ChatGPT analyze stock charts?
ChatGPT can provide insights from written descriptions of market trends but isn’t built to analyze visual or real-time stock charts directly. It offers discussion rather than chart analysis.
What options exist for free technical or stock analysis software with buy/sell signals?
Free technical and stock analysis software options usually offer basic charting, standard indicators, and sometimes buy/sell signals, though they often have feature limits compared to premium versions.
What is TradingView?
TradingView is a popular charting platform that lets traders review markets with customizable charts, a wide range of technical indicators, and a community where insights and strategies are shared.
What is meant by technical analysis tools PDF?
Technical analysis tools PDF refers to downloadable guides or documents that explain chart types, technical indicators, and strategy setups, serving as handy references for traders learning key analysis methods.
What is the 90% rule in trading?
The 90% rule in trading suggests that most trades may yield modest returns or small losses, while a minority of trades produce significant profits, emphasizing the need to manage risk carefully.
