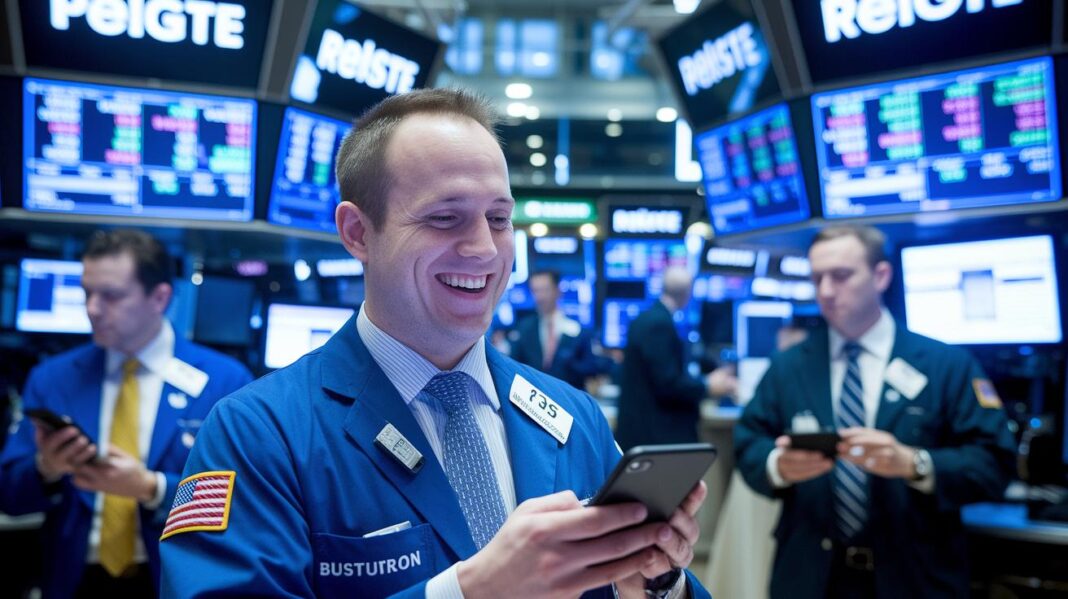
Ever notice how one headline can send traders into a frenzy? Stock market feelings work like a mood ring for trading, changing prices in mere moments.
A single surprising earnings report can spark immediate optimism or caution. Think of it like the buzz before a big game.
Today, we're diving into how these moods drive rapid trades and shape price trends. We'll share clear numbers and easy examples so you can see why grasping this trading vibe might just change your view of the market.
How Stock Market Sentiment Impacts Trading Decisions

Think of stock market sentiment as the overall mood traders share about where prices might head next. When big news like unexpected earnings or a major acquisition comes out, that mood can change fast and cause prices to jump or drop quickly. Picture a scenario where a company drops surprising earnings news, and suddenly, its share price leaps in just a few minutes.
Recent numbers show that the S&P 500 climbed about 1% in one week, with all four major indices even hitting new highs. This indicates that many traders are riding the wave of current market energy rather than fighting against it. A slight 0.25% rate cut, often viewed as a risk-management step, combined with some cautious hints from the Fed, has left investors feeling a bit split about the near future.
How traders feel openly shapes their choices. They check market mood to guess if prices will rise or fall. For a closer look at how these shifts play out, check out stock market trends. When investors are in high spirits, traders may be more ready to take a chance. But if the mood feels wary, trading might slow down or even pull back. This combo of emotion and careful review is what guides everyday trading decisions.
Key Indicators for Measuring Stock Market Sentiment
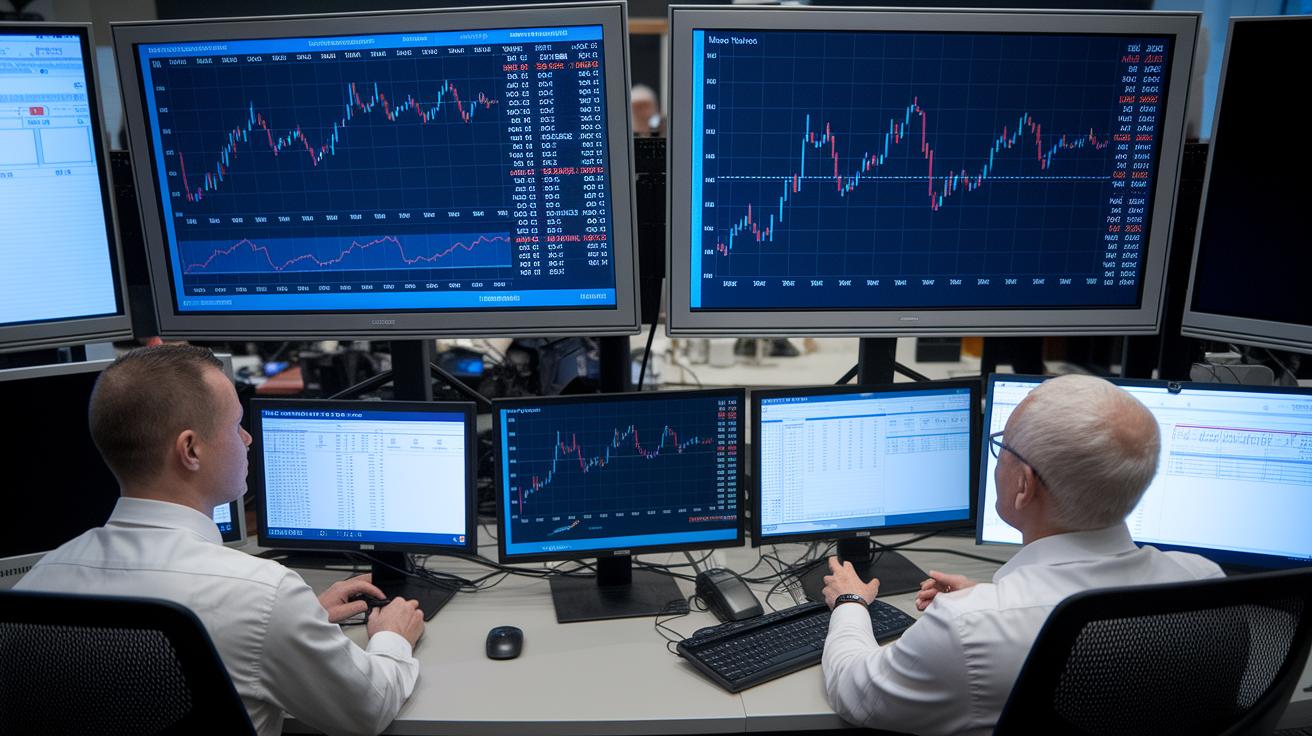
The mood in the market can change in a heartbeat. A recent weekly survey shows that about 42% of investors feel upbeat, another 42% are leaning on the side of caution, and 16% are sitting in the neutral zone looking ahead to the next six months. It’s like being in a room where nearly half the people are cheering while the rest watch every move with a bit of nervous energy.
The S&P 500 recently hit an intraday high of 6,653, a milestone highlighted by its 30-day simple moving average, a steady guide for market trends. But when the Relative Strength Indicator (RSI) goes above 70, it’s like a friendly warning that a pullback might be on the way. In plain terms, think of the RSI as that little signal saying, “Hey, be careful, it might rain soon even if the sun is shining.”
On another note, the Russell 2000 has pushed to a fresh high of 2,467. However, it still needs to close three to four times above 2,442 before its breakout is confirmed, much like a roller coaster needing a few extra loops to ensure you’re strapped in for the ultimate ride.
Market breadth adds another layer of insight. The share of S&P 500 stocks trading above their 200-day moving average fell from 68.54% to 63.40%. In comparison, the Nasdaq sits at 56.47% and the Russell 2000 at 67.22%. These figures provide a snapshot that helps traders see where the overall market might be gaining strength or showing signs of weakness.
Lessons from Historical Stock Market Sentiment Shifts

A well-known study from 1985 found that when investors get carried away by bad news, stocks that had weak returns over the past five years can eventually outperform those with a record of strong performance. It’s like everyone gets overly excited about a downturn, only for the market to slowly make things right again.
On the flip side, sometimes the market is slow to react when big news drops. This delay, called underreaction, gives careful investors a chance to profit, as if waiting for a slow-burning fuse before a clear spark ignites a market move. One writer even pointed out that good news might not immediately push prices higher, letting patient investors step in at just the right moment.
Behavioral finance, which looks at how our feelings shape market moves, suggests that human psychology is a major player in setting stock prices. Still, many experts remain cautious about how much emotion drives these trends. A detailed strategy outlined in the Chicago Booth Review on January 1, 1998, explained ways to take advantage of these common investor mistakes. In short, these insights have helped create trading methods designed to benefit from the natural highs and lows of investor sentiment.
Behavioral Drivers Behind Stock Market Sentiment

When strong emotions like fear and greed take over, traders tend to act in a rush. Imagine someone leaving the best part of a movie because they got nervous, it’s a lot like selling stocks at their peak because worry hit. These feelings often push investors to buy when prices are high or to sell when prices are low, stirring noticeable changes in the market.
Sometimes, traders don’t process key news correctly. For example, if a company releases surprising earnings, a trader might react too strongly, moving the price drastically, kind of like turning the steering wheel too hard on a twisty road. These common mistakes can create clear signals that others can use to find profit opportunities.
Then there’s the impact of high leverage. With 71% of retail CFD accounts losing money, it’s clear that making risky, emotion-fueled moves often ends badly. Trading with extra borrowed funds can turn investing into a wild roller coaster, where sudden twists might leave you feeling out of control.
All in all, how much risk traders are willing to take and the emotions they feel help shape stock prices beyond the basic facts. Picture a scale, with hard numbers on one side and lively emotions on the other. This blend of investor psychology and simple behavioral economics really steers the overall market vibe. For more insight, check out investor psychology and behavioral economics.
Stock Market Sentiment: Uplifting Trading Vibe
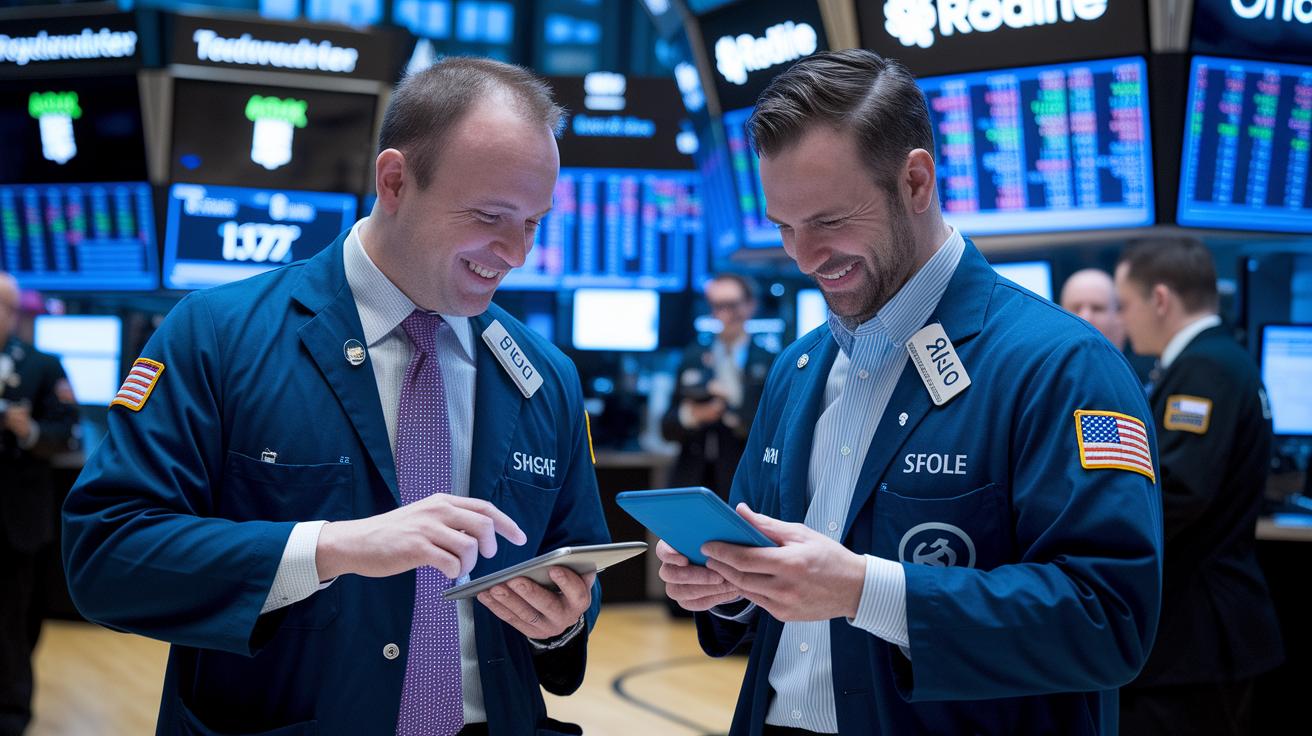
When you mix market mood data with technical and basic checks, it paints a clearer picture of stocks that might be priced too low or too high. These mood signals work like friendly hints, giving you extra clues beyond everyday market numbers. For instance, after a company posts strong earnings, a shift in market mood combined with price trends can fine-tune when you might want to buy or sell.
Right now, the market feels bullish, driven by tech-fueled trends, strong profit forecasts, supportive business policies, and easy money conditions. This sets the stage for investors to feel upbeat. But don’t forget, there is always a chance that rising rates or stubborn inflation may slow things down a bit if prices or yields start to feel the pressure. It’s a bit like tossing fresh ingredients together, you might get a surprising new taste when the right elements come together.
Blending mood metrics with price action helps both quick-turn traders and long-term investors catch the right timing. In fact, many pros now suggest pairing these tools with a broad market look. For more tips on a balanced trading approach, check out investment analysis techniques.
Final Words
in the action, we saw how trader moods drive rapid shifts. We broke down sentiment indicators, explored historical swings, and examined how emotions and cognitive biases can shape the market. By mixing these insights with technical and fundamental analysis, investors can learn to fine-tune their strategies. The interplay of data and human behavior makes stock market sentiment a key part in crafting a smart investment approach. Embrace these ideas with confidence and let them add clarity to your approach in an ever-changing market.
FAQ
What is stock market sentiment today?
The query about stock market sentiment today refers to the current mood among investors about future price moves. It is measured using surveys, charts, and other tools to capture bullish or bearish feelings.
What is a stock market sentiment chart or example?
The query about a stock market sentiment chart means a visual tool that displays investor mood. An example includes using surveys and technical metrics like moving averages and RSI to track healthy, balanced trends.
What is the Fear and Greed Index in crypto and the stock market?
The query about the Fear and Greed Index points to a gauge that quantifies emotional extremes in both crypto and stock markets. It helps translate investor feelings into numbers to guide safer decisions.
What was stock market sentiment in 2022?
The query regarding stock market sentiment in 2022 describes investors’ moods during that period. It reflected caution and optimism in response to economic policies, corporate news, and market shifts.
What is the investor sentiment index and market sentiment in the stock market?
The query about the investor sentiment index refers to a gauge derived from surveys and market data. Market sentiment captures the overall investor mood, influencing trading behaviors and future price decisions.
What is the 90% rule in stocks?
The query about the 90% rule in stocks suggests that most stock movements stay within a common range, with extreme moves potentially signaling shifts in investor mood, highlighting areas for careful trading review.
What is the best sentiment indicator?
The query regarding the best sentiment indicator implies blending survey data, technical signals like RSI and moving averages, and breadth measures. This combined approach offers a rounded view of investor emotions.
How much should a 70 year old have in the stock market?
The query about market allocation for a 70-year-old suggests a conservative setup emphasizing income and stability. Actual percentages depend on individual risk tolerance and personal retirement needs.
