
Ever been caught off guard when a calm market suddenly goes wild? On October 19, 1987, prices plummeted by almost 23% in just a flash. Imagine a quiet lake that suddenly erupts into a full-blown storm. Investors were stunned as numbers dropped quickly and alarms echoed everywhere. This dramatic crash not only shook up the financial world but also forced traders to rethink their game plans. It reminds us that market moods can shift in an instant, teaching us valuable lessons about managing risks when calm turns into chaos.
Black Monday: A Definitive Overview of the Stock Market 1987 Crash
On October 19, 1987, the stock market took a wild dive when the Dow Jones Industrial Average fell almost 23% in just one day. Imagine looking at a calm lake that suddenly turns into a stormy sea, that’s how it felt to watch numbers plummet and alarms go off among traders. It was a shock that left many investors staring in disbelief as the market flipped in a flash.
Before this day of chaos, U.S. markets had been riding high since 1982, with stock prices more than tripling over a few years. In fact, the S&P 500 saw a robust 44% jump in 1987 alone. But even before Black Monday, there were hints that things weren't all smooth sailing. A few days earlier, on October 14 the Dow edged down by 3.8% and then slid another 2.5% on October 15. Those early signs whispered that the market was starting to feel a bit overheated, like a car running too hot on a summer day.
This day isn’t just remembered for the dramatic drop; it changed how people handle investments for good. Regulators and investors had to step back and rethink their strategies and the rules of the game. In short, Black Monday stands as a vivid reminder that market moods can shift in no time, urging us to always be alert and ready to adjust our approach.
Unpacking the Primary Causes Behind the 1987 Stock Market Crash
Back in 1987, program trading really changed the game. This method uses computer systems to automatically execute buy and sell orders without waiting for a human touch. When certain signals popped up, these systems quickly piled on sell orders. Think of it like a row of dominoes; one order would trigger another in rapid succession, sparking a sell-off that the market struggled to slow down.
Portfolio insurance was another major player in the downturn. Investors used it as a kind of safety net by hedging with S&P 500 futures (futures contracts are agreements to buy or sell an asset at a future date with a predetermined price). In simple terms, it automatically called for selling when stock prices started to slip. As prices dropped, more orders were triggered automatically, pushing the market down even further in a vicious circle.
Another factor was the sky-high stock valuations built up over years of a booming market. Stocks had climbed so high that they couldn’t handle even a slight downturn. Imagine a balloon stuffed with too much air; even a tiny prick could set off a fast, uncontrolled deflation. High hopes paired with shaky fundamentals made the market extra vulnerable to a sharp drop.
All these forces combined to create a perfect storm. The blend of fast, automated sell orders from program trading, the safety-net trigger fallout from portfolio insurance, and overheated stock prices led to a rapid and dramatic slide. This mix of cutting-edge technology and reactive trading strategies turned a market dip into an event that still sheds light on our financial risks today.
Timeline of Turmoil: Charting the October 1987 Slide in the Stock Market
October 1987 saw the market in a real whirlwind. One day it was dropping hard, and the next, there was a surprising bounce back. On October 14, the Dow slipped by 3.8% with roughly 140 million shares traded, setting a nervous tone. Then, the following day, the market stayed jittery with uneasy trading patterns. But nothing compared to Black Monday on October 19, when the Dow plunged 508 points (a 22.6% drop) as about 600 million shares exchanged hands. This shocking fall got everyone talking and even nudged regulators to take note. By October 20, things took an unexpected turn: a 5.1% recovery on 230 million shares helped ease the tension, much like an unforeseen twist in a gripping tale that makes you see the whole picture differently.
| Date | Dow % Change | Trading Volume |
|---|---|---|
| October 14, 1987 | -3.8% | ~140 million shares |
| October 15, 1987 | -2.5% | High volatility |
| October 19, 1987 | -22.6% (508 points) | ~600 million shares |
| October 20, 1987 | +5.1% | 230 million shares |
This rundown shows how a major drop led to record trading volumes, only for a quick rebound to bring a bit of relief. It’s like watching a game suddenly shift gears when you least expect it.
Global Repercussions of the Stock Market 1987 Crash

When the U.S. stock market took a steep dive, the shock spread around the globe very quickly. On October 20th, European markets fell by up to 12% and Asian markets started the day down between 8% and 10%. It was a clear reminder that the world's financial systems are closely linked. Imagine tossing a rock into a still pond, one drop stirred up ripples everywhere.
In major hubs like Tokyo, London, and Hong Kong, a cash crunch made it hard for money to move smoothly between countries (liquidity means how easily an asset can be turned into cash). The overall stock value around the globe dropped by about $1 trillion, a loss that felt almost real. Think of it like trying to hold water in your hands, both large companies and regular investors suddenly found themselves short on cash. This crash pushed everyone to rethink their investments and changed how investors acted as they adjusted to the shock and shortage of funds.
Investor Sentiment and Behavioral Shifts During the Black Monday Crash
Margin calls sent shockwaves through the market when brokers demanded extra funds, forcing traders to sell off their positions quickly. In that heated moment, fear overpowered careful planning, almost like watching a row of dominoes collapse one after the next. It was as if calm calculations gave way to pure emotion, and even the tiniest dip in price sparked a flurry of selling that deepened the market’s woes.
- Brokers urgently asking for more cash led to rapid, widespread selling.
- Traders began to follow each other, their decisions driven by panic.
- Short-selling soared by over 150% as aggressive moves replaced cautious strategies.
- The usual careful way of checking stock values was lost to fear.
- Automated sell orders only made the market drop even faster.
This blend of emotion and automated trading changed the face of the market on that day. As investors reacted to margin calls, followed each other in a rush, and turned to aggressive tactics like short-selling, even a slight signal of doubt had the power to trigger large market moves. It’s a reminder of how quickly fear can take hold and shape the whole trading scene.
Recovery Patterns After the Stock Market 1987 Crash

When the market hit its lowest point, something really unexpected happened. In just three trading sessions, the Dow bounced back by recovering 288 of its 508-point drop, regaining more than half of its losses by October 23. This quick turnaround shows how fast the market can react when people start feeling hopeful again.
- By October 23, the Dow had recovered over 50% of its losses.
- The S&P 500 managed to claw back 70% of its losses in just four weeks.
- It took until March 1989 for the market to return to pre-crash levels.
This kind of recovery stands out from other big downturns, where returns have usually been slow and steady. Here, a mix of eager buying and quick moves to cover short positions sparked a rebound that few anticipated. It’s a clear reminder that even after a huge shock, markets can sometimes bounce back much faster than we might think.
Regulatory Reforms and Policy Shifts Sparked by the 1987 Crash
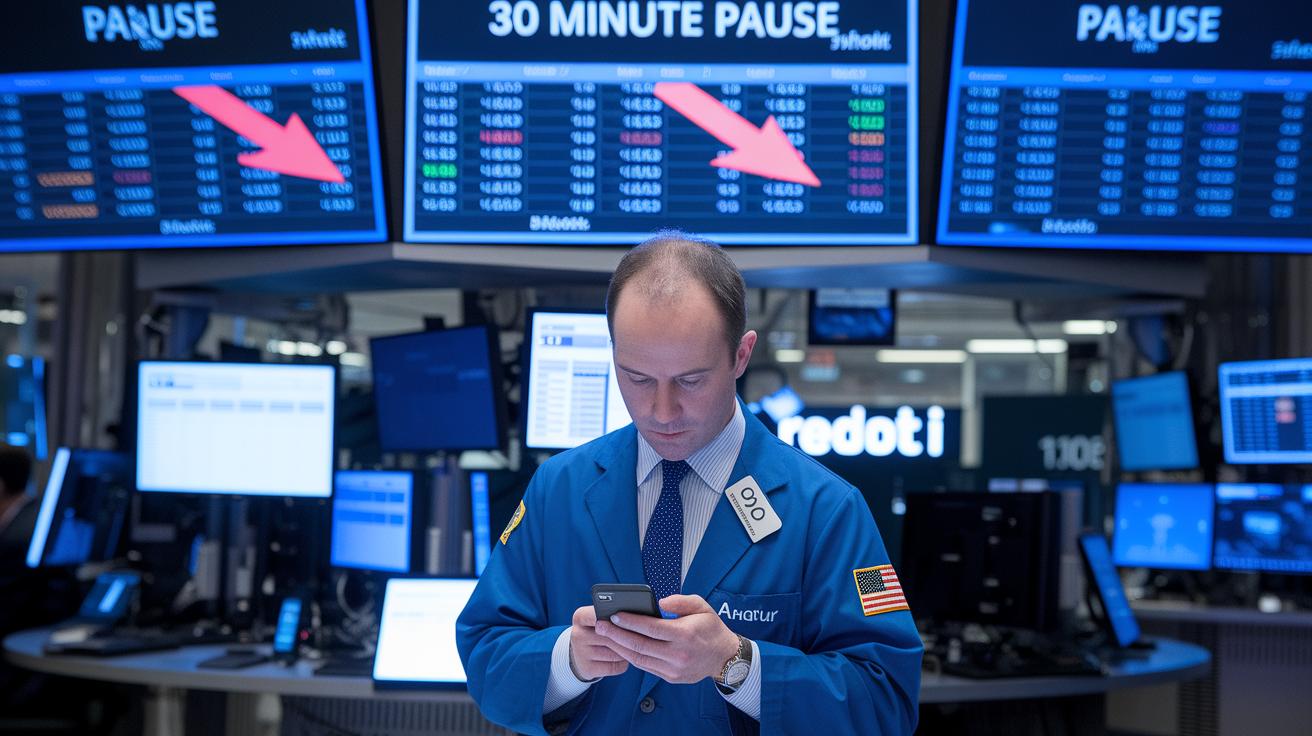
Right after the 1987 crash, U.S. regulators jumped in with new safeguards to calm a wild market. A big influence was the Brady Commission’s 1988 report, which suggested using circuit breakers. These breakers, in simple terms, are built-in pauses that stop rapid trading drops by temporarily halting transactions when prices fall too fast. For example, under SEC’s Rule 80B, trading would pause for 30 minutes if the market dropped by 250 points. This break gave everyone a moment to catch their breath during the chaos.
These steps were all about stopping massive sell-offs and protecting investors from panic. The idea was to let the market cool off, so that even when fear set in, there was a brief pause before more sell orders could drive prices lower.
Soon enough, the new rules spread far beyond U.S. borders. Major exchanges in Europe and Asia saw the benefit of these safeguards and introduced their own pause systems by 1989. These controls, similar to the U.S. ones, stopped trading temporarily during sharp drops. This helped ease the intense pressure and rebuild trust among investors. One quick look at European markets shows they quickly adopted their own control systems after the U.S. measures took effect.
Even today, experts keep a close eye on these reforms. Analysts review how these crash-prevention techniques have held up over time and explore ways to improve them. It’s a good reminder that lessons from the past can help shape smarter, safer markets in the future.
Risk Management Lessons From the Stock Market 1987 Crash

The big crash in 1987 taught us some real, hard lessons about the weak spots in our markets. It showed that spreading your investments around, which we call diversification, might not work when a lot of assets drop at the same time. Many companies found themselves in trouble because they didn’t have enough cash available to cover sudden demands (cash that you can use quickly). Also, relying too much on portfolio insurance, a tool meant to protect investments, only made things worse when its automatic sell orders kicked in and deepened the downturn. After the crash, traders and experts started rethinking their plans and looking for stronger, more agile ways to handle market messes.
- Use quick, flexible hedging strategies (methods to protect against big losses) so you can adjust your positions fast when the market gets shaky.
- Keep good cash reserves, a solid liquidity buffer means having extra cash at hand to cover sudden demands.
- Regularly test your financial plans by running stress tests that simulate different market shocks, helping you see what might go wrong.
- Practice crisis management with drills so your team is ready to act quickly when trouble hits.
- Review your diversification strategies often to make sure you’re not putting too many eggs in one basket.
In short, the 1987 crash changed the way companies deal with risk. By adopting fast-acting hedging methods, businesses are now better prepared for unexpected market shifts instead of getting trapped by automatic sell orders. Maintaining enough liquid cash has become a key part of smart risk management, helping to guard against rapid sell-offs. With regular stress tests and crisis drills, old reactive approaches have given way to proactive plans. This crash not only exposed the flaws of an outdated playbook but also helped build a new foundation for managing today’s markets.
Comparative Study: Stock Market 1987 Crash Versus Other Major Downturns

Looking back, the 1987 crash is one of those moments that sticks with you. It hit the market hard and fast. For example, back in October 1929, the market dropped 12.8% in one day under very different conditions. By contrast, in 1987 the Dow fell 22.6% in just one day, largely because of new tools like program trading (a way for computers to buy and sell stocks automatically). And then, the 2008 crisis saw rough, multi-week declines with a peak drop of 8% in one day. Ever notice how technology and investor mood can change everything?
| Crisis | Date | Single-Day % Drop | Recovery Duration |
|---|---|---|---|
| 1929 (Stock market crash 1929) | October 1929 | 12.8% | Nearly 25 years |
| 1987 | October 1987 | 22.6% | 15 months |
| 2008 | October 2008 | 8% | Multi-week decline |
Each of these downturns had its own story. In 1929, there was no computerized trading, so decisions came from human judgment. The 1987 dip was driven by automated sell orders that acted on their own. And in 2008, complex financial products put extra stress on the system. In short, these events show just how different tools and investor feelings have changed the way markets bounce back over time.
Final Words
In the action, this article walked through the key events that shaped the stock market 1987 crash, from its dramatic percentage drop and the role of automated trading to the major reforms and risk management lessons that followed.
We broke down the timeline, global impact, and critical investor behavior shifts in bite-sized insights. The detailed recap helps remind you how history informs today’s digital asset strategies. It’s refreshing to see how past events light the way for smarter market decisions.
FAQ
Q: What is the history of the 1987 stock market crash?
A: The 1987 stock market crash history is marked by Black Monday, when U.S. indices fell dramatically in October, shattering previous records with a 22.6% drop in one trading session.
Q: How is the 1987 stock market crash viewed today?
A: The 1987 crash today is seen as a key moment that taught traders about market volatility and pushed new rules, still influencing trading patterns and risk management practices.
Q: What does the 1987 stock market crash chart reveal?
A: The 1987 crash chart highlights the sudden decline, including the historic Black Monday drop and the uneven market activity in the days leading up to and following the event.
Q: How does the 1987 stock market crash graph illustrate the event?
A: The crash graph visually outlines the steep fall in stock prices, capturing the dramatic drop on October 19, 1987, and the turbulent market shifts before and after that day.
Q: How is the 1987 stock market crash explained?
A: The crash is explained by the quick selling triggered by automated trading and portfolio insurance strategies during a time of high market valuations, which set off a rapid decline.
Q: What is known about Black Monday (1987 deaths)?
A: Black Monday (1987 deaths) refers to the indirect human toll during the panic, with market instability causing widespread economic stress, although direct fatalities from trading are not widely attributed.
Q: What happened during the Black Friday stock market crash of 1989?
A: The Black Friday 1989 crash saw significant drops spurred by lingering fears from earlier turmoil, prompting a sharp decline as markets reacted to regulatory and investor uncertainties.
Q: What caused the 1987 crash, including Black Monday?
A: The crash was caused by automated trading systems and portfolio insurance methods that amplified selling. High market valuations from a long bull run made the market vulnerable to such a rapid plunge.
Q: How did the 1987 stock market drop compare to the 1929 crash?
A: The 1987 event had a steeper single-day drop of 22.6% compared to the 12.8% fall in 1929, though each crash had different overall impacts and recovery patterns.
Q: How long did it take the market to recover from the 1987 crash?
A: Key rebounds occurred within days, but full recovery to pre-crash levels took until March 1989, illustrating a mix of quick gains and a longer-term healing process.
Q: What led to the stock market crash of 1989?
A: The 1989 crash resulted from persistent investor anxiety following past volatility combined with external economic uncertainties, which triggered sharp market declines that echoed earlier turbulent events.