
Have you ever thought a quick look at a chart could lead to smart trades? Price action analysis (a way to watch how prices move without getting lost in fancy tech talk) lets you see the market’s natural flow clearly.
Instead of getting caught up in confusing buzzwords or high-tech indicators, you focus on simple signals like candlestick shapes (those little blocks that show price changes) and support levels (points where prices tend to bounce back). This clear, straightforward method helps you spot both fast opportunities and longer trends.
In this guide, we explore how these visible price moves can point to the best moments to act. It’s all about giving you a more confident, timely way to make your trading decisions.
Price Action Technical Analysis Sparks Smart Trades

Price action trading looks at the simple movements of prices over time. It focuses on what you see in the charts like candlestick patterns and areas where prices tend to turn, known as support and resistance zones (price levels where buying or selling pressure may change). This method feels clear and direct, making it a hit with both everyday traders and big institutions.
By watching the raw price shifts, traders pick up on the market’s natural rhythm. They don’t rely on a flood of computer signals; instead, they trust what the price is doing to give clues about what might happen next. Traders often check both short-term and long-term charts to build a full picture of market trends. With defined plans that include stop-loss orders to limit losses, proper position sizes, and clear profit targets, this approach offers a practical way to make smart trading choices.
- Support and resistance levels show where prices might reverse
- Candlestick patterns hint at shifts in market mood
- Breakout points suggest a chance for quick price jumps
- Range analysis helps understand when the market is steady or volatile
- Multiple time frame checks give a broader market view
- Risk controls like stop-loss orders protect your money
- Clear entry and exit strategies guide well-timed trades
These key ideas work together to help traders make real decisions. When you study a chart, you learn when the market shifts its focus from selling to buying. In short, turning raw market data into clear signals helps you decide the best time to enter or exit a trade. It all comes down to reading the market’s subtle cues and acting with both care and insight.
Price Action Candlestick Pattern Insights

Understanding candlestick patterns is key to catching market changes. These visual clues show how traders feel and can hint at a possible change or continuation in the trend. For instance, when a candlestick suddenly shifts its structure, it might mean the market is about to change direction.
Inside Bar
An inside bar forms when one candle’s high and low sit neatly within the range of the previous candle. This pattern tells us that the quick market momentum has slowed down, setting up a potential breakout and a fresh trend ahead.
Pin Bar
A pin bar has a tiny body but a long tail. This shape tells you that buyers or sellers pushed back against market pressure. It can signal a reversal if that long tail shows a strong rejection of higher or lower prices.
Fakey Pattern
The fakey pattern looks like a breakout at first, only to quickly switch course. A bullish fakey starts with a drop then bounces back up, while a bearish fakey does the opposite. This pattern serves as a warning that the market might be tricking you before continuing its current trend.
| Pattern | Trade Signal | Interpretation |
|---|---|---|
| Inside Bar | Breakout potential | A quiet moment before a big move |
| Pin Bar | Reversal cue | Rejection of price extremes |
| Fakey Pattern | False breakout alert | Be cautious before a move continues |
When you add these patterns to your chart reading, it becomes easier to choose when to enter or exit a trade. In short, these insights can bring a clearer view to your trading decisions.
Price Action Support and Resistance Detection

Support and resistance levels are like familiar markers on a chart where prices tend to bounce or slow down. They show where buyers and sellers step in and change the balance of the market. Traders often watch these points closely because they help decide the best times to enter or exit a trade.
Identifying these zones is pretty simple. Many traders draw lines at swing highs (the top points) and swing lows (the bottom points) to mark these important areas. This visual approach makes it easier to see when a price might reverse direction or keep trending. When you spot these key levels correctly, you can set up trades that have a better chance of success and avoid holding positions when a change is coming.
Here's a quick, step-by-step guide to setting these up:
| Step | Description |
|---|---|
| Find Past Highs and Lows | Look back at the chart to see where prices reversed direction |
| Draw Horizontal Lines | Mark these turning points clearly on your chart |
| Check Different Time Frames | Make sure these levels are important on more than one time scale |
| Watch the Volume | Notice any spikes in trading near these key areas |
| Look for Retests | See if the price revisits these levels before moving further |
It’s also important to tell the difference between a false break and a true reversal. Sometimes the price might push past a line, looking like it’s breaking out, but then quickly fall back. That’s a false signal. But when the price decisively bounces back from a level, it confirms that the support or resistance is strong and real.
Price Action Trend Analysis Techniques

Price action trend analysis gives traders a clear look at how prices move by studying the simple shifts in the market. Instead of relying on complicated tools, traders use easy-to-read chart signals to see where things are headed. It’s a bit like noticing the quiet rhythm of daily life and then spotting when something changes.
By drawing lines on a chart to follow the price, checking different time periods, and watching for clear swing highs and lows, traders feel more confident about when to get in or out of a position. It’s all about tuning into the natural pulse of the market and making decisions based on what you see.
- Sketching lines that trace the price’s path
- Looking at longer time frames to get a full picture
- Checking swing highs and lows to find spots that might turn around
- Watching for breakout candles that hint at new moves
- Seeing if the price keeps following the pattern to be sure it’s real
- Using temporary stops as a simple way to control risk
MSFT Uptrend Case Study
Back in early 2024, Microsoft’s stock moved upwards so smoothly it reminded traders of a calm river flowing steadily. By drawing clear lines from the recent lows and spotting breakout candles, traders saw that the uptrend was strong. They looked at several time frames and noticed that the price stayed above these lows. This helped them decide where to set temporary stops, matching the lively rhythm of the market. In short, using these simple trend techniques, traders could decide the best times to enter, protect their gains, and avoid sudden reversals.
Price Action Trade Entry Timing and Exit Optimization

Getting the timing right when you open or close a trade is super important. When you watch the chart closely, you can set a stop-loss (a limit to how much you can lose) right below a low swing or just above a high swing, make sure your trade size fits your money, and aim for profits based on recent price moves. It’s about balancing a bit of risk with the chance to win.
Entry Triggers:
- Pin-bar rejection
- Inside-bar breakout
- Trendline bounce
- Pivot reversal
- Fakey signal
Exit Triggers:
- Opposite candlestick reversal
- Failure swing
- Trend exhaustion
- Range limit
- Fibonacci level
| Entry Signal | Stop-Loss Position | Profit Target | Risk-Reward Ratio |
|---|---|---|---|
| Pin-bar rejection | Below recent swing low | Near pivot high | 1:2 |
| Inside-bar breakout | Above confirmation level | Recent resistance | 1:2.5 |
| Trendline bounce | Stop set at trendline breach | Next validated level | 1:3 |
Keeping a balance between bold moves and smart risk means being methodical while staying flexible. Even if a signal looks strong, sticking to your exit rules helps keep your emotions in check. In short, combining clear entry signals with smart exit points and proper risk control can turn the raw energy of price action into thoughtful trades.
Price Action Risk-Managed Strategies

Managing risk is a must in price action trading. It means having clear steps in place to defend your money and stop unexpected losses. Having smart, practical controls not only builds your confidence but also helps you stick to your game plan when the market feels unpredictable.
Think of it this way: every trade is like a mini-project, and you want to check all the possible triggers for things going wrong, like taking on too many trades at once or letting feelings cloud your judgment.
- Set your stop-loss at a point where your trade plan would be invalid.
- Keep your position sizes small so you risk no more than 1–2% of your total funds on any trade.
- Use trailing stops to safeguard the gains you’ve made as prices move in your favor.
- Place limit orders to lock in your exit levels in advance.
- Do a quick risk-reward check before stepping into any trade.
- Follow your planned signal criteria and avoid letting emotions drive your entries.
Take some time to review each trade setup carefully. Sometimes traders lean too much on eye-catching patterns without real risk measures, or they jump into moves that aren’t fully confirmed. By sticking to a systematic, risk-managed strategy, you can avoid big losses and keep your trading approach balanced and thoughtful.
Price Action Technical Analysis Real-World Examples
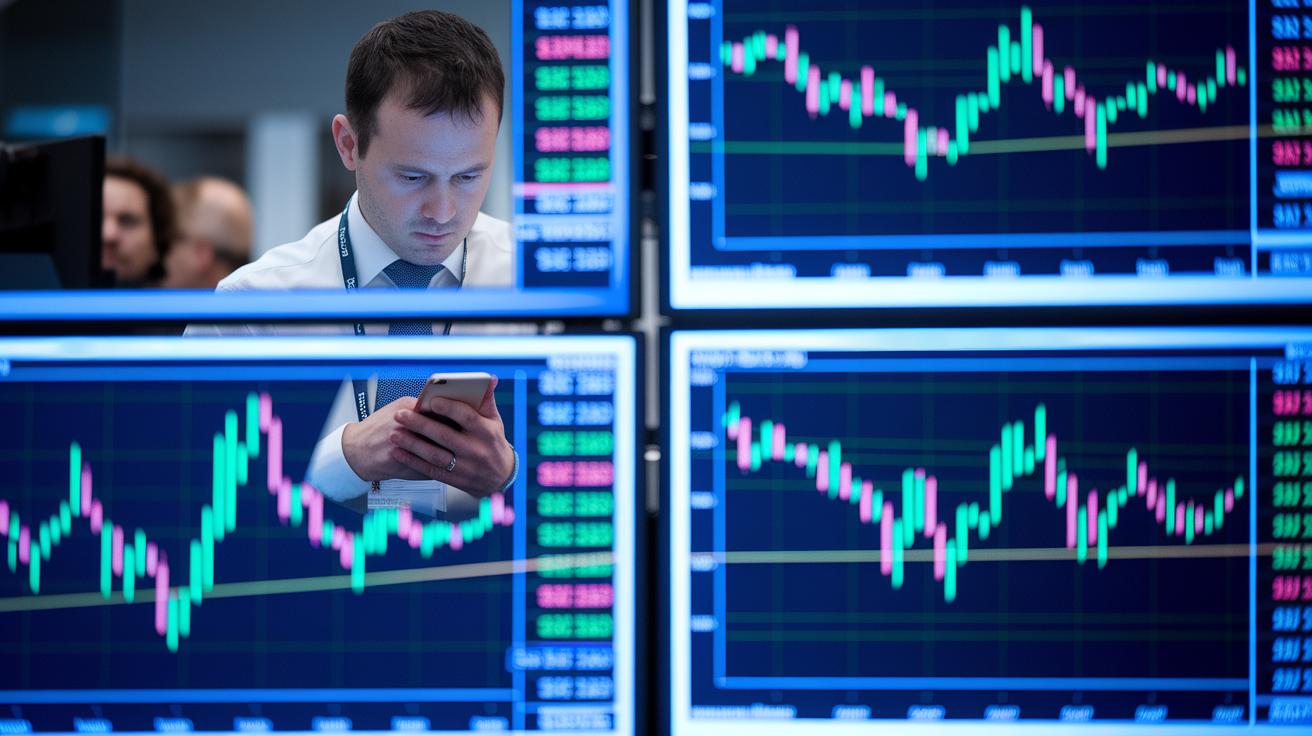
Price action technical analysis looks at live market shifts and turns raw numbers into clear signals you can act on. It’s like watching the steady pulse of digital transactions and then knowing when to jump in or step back.
QCi Volatility Case Study
- QCi shot up by 1,713% in early 2024. This strong surge signaled a breakout (a quick jump from previous prices, hinting at a rapid move) as the market spread out fast.
- Shortly after, it dropped 44.21%, a clear reversal signal in a very unstable (or volatile) market.
- This swift climb followed by a steep fall shows why it’s important to spot both breakout moments and early hints of a pullback.
- Such big swings remind traders to keep an eye on fast changes and to use clear price patterns to decide when to enter or exit in a rapidly moving market.
Enovix Recovery Example
- In the first part of 2024, Enovix saw its revenue dip from $7.4M to $5.3M, which might have seemed like a red flag.
- Yet, the company held on to a strong cash reserve of $264.5M (cash reserve means money available to cover immediate needs), showing a solid financial foundation.
- The stock then rebounded from $5.70 to $10.48, with a Nasdaq target of $31.38, showing how price action can quickly react to shifts in a company’s fundamentals.
- This bounce back demonstrates that even if there’s a revenue drop, a strong financial base can help guide smart trading decisions based on price moves.
These real-world cases show just how essential it is to pay attention to price action. By watching market shifts like those seen with QCi and Enovix, traders can learn to turn unpredictable moments into clear, actionable opportunities.
Final Words
In the action, we broke down key ideas from price action fundamentals through trend analysis and precise entry and exit tactics. We highlighted how reading candlestick patterns and identifying support and resistance levels can guide smart trading decisions. Risk controls and real-world examples tied everything together, showing how to use price action technical analysis in real life. This practical insight is meant to boost confidence in building a robust digital asset portfolio and making sound investment choices. Keep your strategy tight and your outlook positive.
FAQ
What is a price action indicator?
The price action indicator refers to a tool that uses raw price movements and trends to signal market shifts, offering immediate insights into supply and demand dynamics without relying on added technical measures.
What are price action patterns?
Price action patterns represent repeatable market movement shapes that aid traders in spotting potential reversals or continuations, providing clear cues for entry and exit strategies based solely on price behavior.
What is a price action strategy?
A price action strategy involves making trading decisions based purely on the analysis of price movements and key market levels, allowing traders to determine entry points, stops, and profit targets with built-in clarity.
How does price action compare with technical analysis?
Price action compared to technical analysis focuses solely on raw price behavior rather than multiple indicators, helping traders gauge market sentiment more directly. The choice depends on personal trading style.
What are some price action trading examples?
Price action trading examples show real scenarios where traders use price levels, candlestick patterns, and trend signals to decide when to enter or exit trades, providing practical, visually guided methods.
What does a price action patterns PDF offer?
A price action patterns PDF provides documented examples and clear explanations of common market formations, serving as a handy reference guide to recognize key candlestick setups and structure changes.
What does a Price Action book provide?
A Price Action book offers comprehensive insights into price-based trading techniques, real-world examples, and practical steps. It simplifies complex market moves with clear narratives and actionable tips.
What can be found in an advanced price action trading PDF?
An advanced price action trading PDF presents detailed strategies, refined pattern recognitions, and sophisticated setups, making it ideal for experienced traders seeking deeper market analysis and sharper techniques.
What is price action in technical analysis?
Price action in technical analysis emphasizes observing pure price moves rather than relying on many additional indicators, which helps traders interpret market sentiment and define important support and resistance levels.
What does the 3 5 7 rule in trading mean?
The 3 5 7 rule in trading outlines a framework for timing entries by considering short-, medium-, and long-term price movements, guiding traders to balance potential risks and rewards effectively.
What is the 90% rule in trading?
The 90% rule in trading indicates a high probability for trades that meet specific, predefined conditions. It serves as a guideline to help traders manage risk while setting realistic profit targets.
