
Have you ever thought that the market might have a heartbeat? Market sentiment analysis works like a pulse monitor by tracking how investors feel, whether they are excited or careful. We look at news headlines, shifts in the economy, and even chatter on social media to capture the market’s real-time energy.
It’s much like a small shop owner feeling a sudden buzz on a busy day. This method helps shine a light on early signals so investors can notice trends before big changes hit.
Market Sentiment Trends Analysis Boosts Investment Insight

Market sentiment trends analysis is all about understanding how investors feel. We look at news, economic signs, and even social media chatter to see if people are feeling upbeat or a bit cautious. It’s like taking the market's pulse in real time. Think of it like a small shop owner noticing the buzz during a local festival, only on a much bigger scale.
When investors watch data as soon as it comes in, they get fast feedback and hints about where prices might move next. This real-time look helps spot early buying or selling signals before big changes hit the market.
Big-picture economic factors also shape how investors feel. Low taxes, strong economic growth, and solid spending on research all help create an inviting environment for money from overseas. For example, when a country ramps up its research spending, it often lifts investor spirits, making them feel excited about potential growth.
Some key tools in this analysis include the VIX, which shows how nervous the market might be; the NYSE High/Low indicator, which gives a feel for overall market action; and the 200-day moving average, which helps track longer trends. Imagine these tools as different gauges on a car’s dashboard, each one adds a little more to the full picture of market performance.
Data Sources and Tools for Market Sentiment Trends Analysis
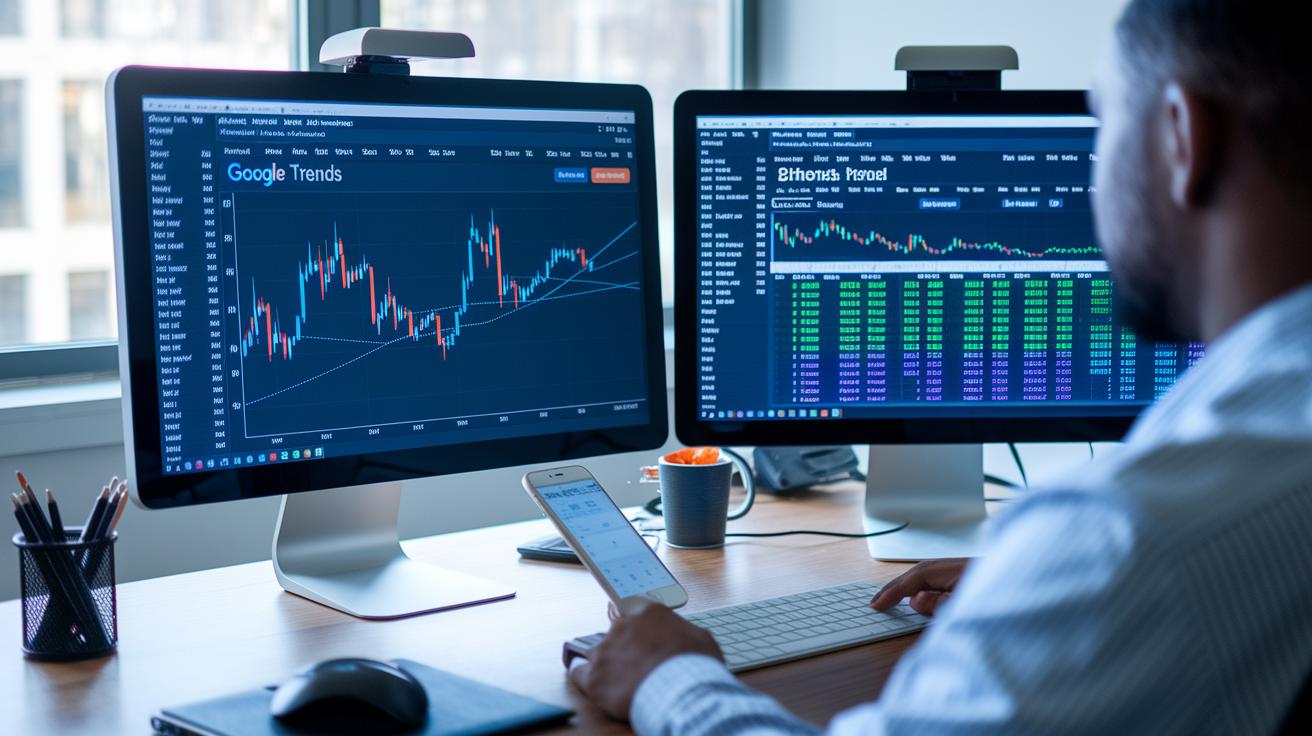
Investors today lean on smart data feeds that let them catch the market’s pulse in real time. Google Trends, for example, turns search spikes into simple charts so you can see how events, like earnings reports, send ripples through the market.
StockTwits picks up on live investor chatter. It feels like tuning into a friendly conversation where you instantly notice shifts in mood.
Then you have Sentifi, which collects data from places like Twitter, Reddit, and financial news. Using AI (that is, computer systems that learn from patterns), it sorts through the buzz to spot emerging trends in how people feel. The Bloomberg Terminal adds its own twist by combining broad market moves with small, detailed shifts via custom alerts. Dataminr also uses smart AI tools to send real-time alerts on breaking news and the reactions they spark.
These tools offer a behavior-based view of the market so you can act quickly when things change. By mixing numbers with community tone, you get a complete picture of market sentiment. If you’re curious to dive deeper, check out this link to trend analysis tools for traders.
- Google Trends: It turns search spikes into easy-to-read charts.
- StockTwits: It transforms live investor chatter into clear signals of sentiment.
- Sentifi: It gathers and sorts online data to show you the market’s mood.
- Bloomberg Terminal: It brings together big-picture moves and smaller shifts with alerts tailored just for you.
- Dataminr: It uses AI to quickly flag key news events and the feelings they trigger.
Metrics and Indicators in Market Sentiment Trends Analysis
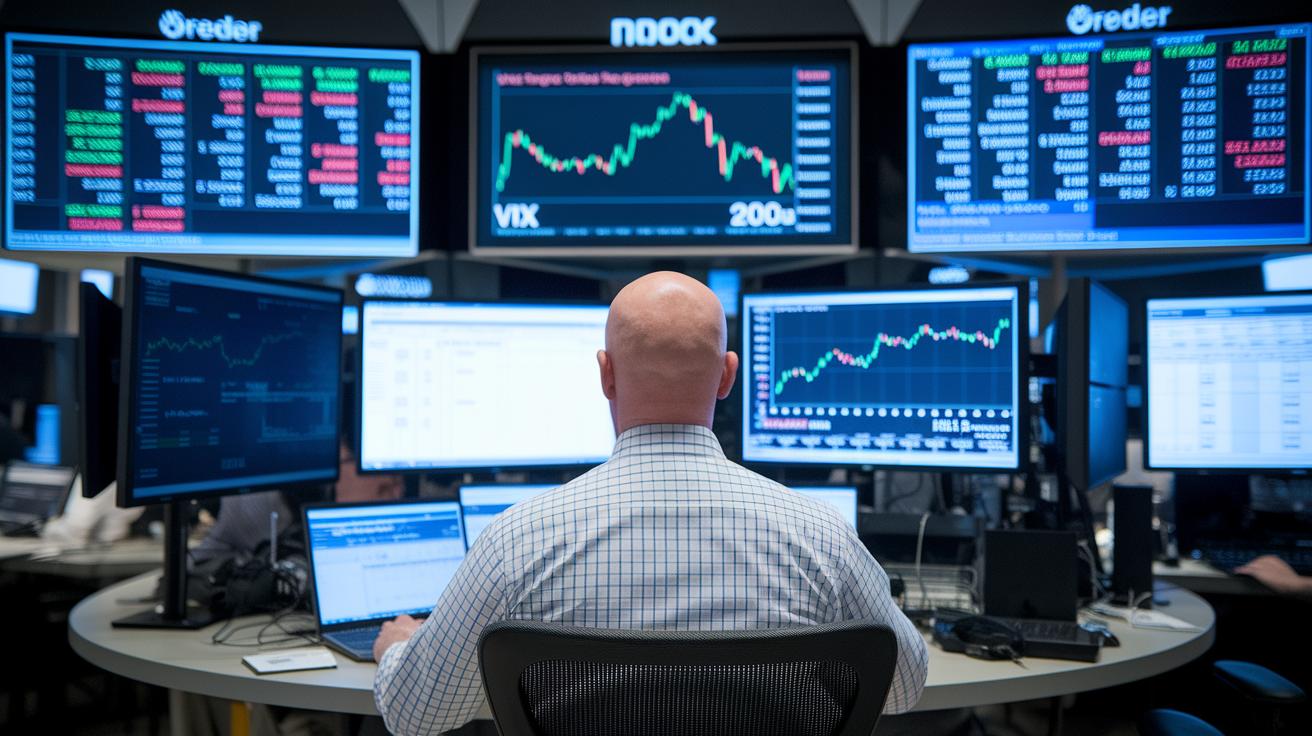
Investors look at several data points to gauge the market's mood. The volatility index, or VIX (a measure that shows how scared or nervous investors are, similar to a warning light in your car), helps signal when a reversal might occur. It’s like that moment when you feel something’s off while driving.
Then there's the NYSE High/Low Indicator. This tool checks how many stocks are rising versus falling and gives a quick look at whether the market feels optimistic or cautious. It’s a handy gauge for understanding overall market balance.
For a broader perspective, the 200-day moving average comes into play. This metric smooths out the daily ups and downs to show the steady rhythm of the market over months. Think of it as tracking a slow, persistent heartbeat, rather than the quick pulses of daily change.
A modern twist to sentiment analysis is emoji analytics. By counting over 10 billion emojis used every day, about 7 million per minute, it picks up on subtle digital cues in investor chatter. Imagine skimming through online messages and spotting emojis that signal tiny shifts in mood; it’s a fresh way to read the crowd.
Media coverage also plays a big part. A positive headline can spark a buying spree, while a negative one might trigger selling. Such news can quickly change how investors feel and act in the market.
All together, these metrics blend cold, hard data with human emotion. They help paint a full picture of what’s happening in the market, guiding investors through the twists and turns of financial trends.
Methodologies Behind Market Sentiment Trends Analysis

We start by setting up a project that gathers data from news sources, social media, and financial feeds. Think of it like placing little sensors all over to catch every whisper from the market. For example, a trader might arrange these feeds to get quick updates, much like checking the weather before you head out.
Next, we break down the data into three simple groups: bullish, bearish, and neutral. This makes the busy market chatter easier to digest. For instance, if most of the talk is very positive, it could be a sign that the market is leaning bullish.
Then, we dive a bit deeper by using natural language processing (NLP, a tool that helps computers understand human speech). This step picks up on tiny emotional hints that simpler methods might miss, much like noticing a slight change in a friend's tone during a chat.
After that, we bring in emoji analysis to add more emotional detail. Even a simple smiley or frown can reveal a lot about investor feelings. Imagine scanning thousands of tweets and spotting more and more emojis that hint at a change in mood.
We also apply AI-driven topic analysis to pull out the main themes from all the data. This is like listening for a repeating chorus in your favorite song, it helps highlight the ideas that keep coming back.
Lastly, we track these sentiment trends over time to see cycles, shifts, and any odd changes. It’s much like watching a movie frame by frame to make sure you catch every little moment. This step-by-step approach sets the stage for a clear understanding of market sentiment.
Visualization Techniques for Market Sentiment Trends Analysis
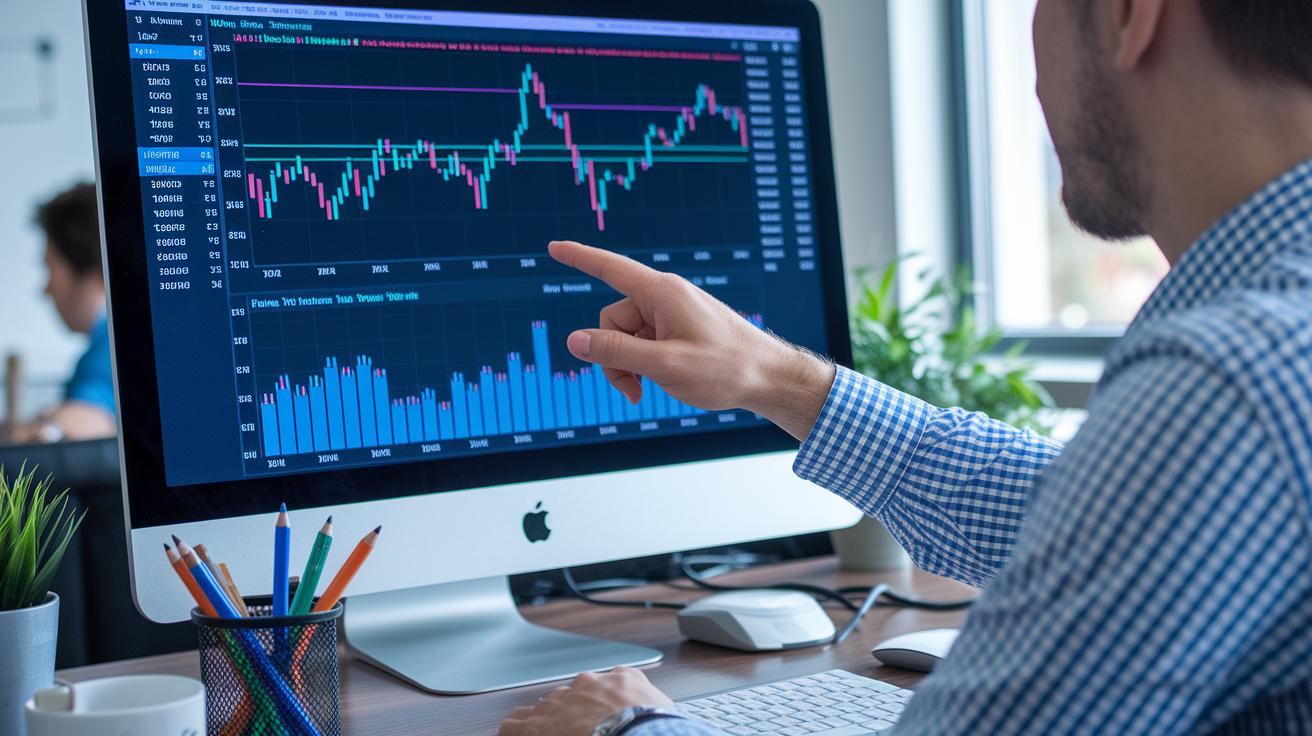
Time-series charts are a lot like the market's pulse. They track how investor feelings move around big events like earnings reports or key Fed moves. I often hear investors say these charts give them a clear look at market moods, sort of like watching excitement level peak when major news hits.
Heatmaps are another handy tool. They show you which parts of the market are feeling upbeat and which might be a bit cautious. It’s like viewing a colorful map where each shade represents a different investor emotion.
Then there are word clouds. They collect the most common words and even emojis from social feeds, offering a quick glimpse into what investors are talking about. Picture scrolling through tweets and quickly noticing which words and icons are trending, hinting at shifts in market behavior.
Dashboards pull everything together in one clear view. They blend sentiment scores, trading volumes, and price relationships so you can see the big picture at a glance. Many investors find that a well-made dashboard makes the often complex market dynamics as easy to understand as one neat chart.
Market Sentiment Trends Analysis in Practice: Case Studies

Nvidia's first-quarter earnings in 2025 clearly show how market sentiment trends analysis works. Investors noticed a burst of online chatter that moved prices by about 15%. Imagine a chart where every spike in excitement lines up with a jump in the stock price; that's exactly what happened with Nvidia. This real-time connection between online buzz and market movement can help guide quick decisions.
A big tech company recently considered expanding in Southeast Asia. Their review of online chatter pointed to Vietnam as a standout market. The numbers showed strong innovation potential and lower labor costs, even if Vietnam is still considered a lower-middle-income country. In other words, it was like picking the juiciest fruit from a bowl after looking closely at each one. Investors saw this blend of promise and current reality as a signal to move forward with expansion.
In both examples, tools like Semantic Visions were key. They mix up-to-the-minute data with historical sentiment so you get the whole picture. These tools capture the steady hum of online discussions and turn that into clear insights, ensuring investors are never caught off guard.
Keeping a constant watch on market sentiment is crucial in today's fast-paced world. By tracking these trends, investors can spot early risks or notice the seeds of a new opportunity. It takes a rush of digital chatter and transforms it into a clear, data-driven perspective that shapes smarter risk evaluation strategies.
- Nvidia’s earnings were boosted by online buzz that coincided with a 15% price move.
- A tech firm used sentiment trends to highlight Vietnam’s potential for expansion.
For a more detailed look at these techniques, check out analyze market trends.
Final Words
In the action, the blog broke down market sentiment trends analysis into understandable steps. It covered the basics of investor mood evaluation with key data points like the VIX and moving averages. Real-time tools, like Google Trends and StockTwits, paired with clear visualization techniques, offer a practical framework. Each section showed how data-driven market perspectives can guide strategic decisions. The insights shared empower investors to build a robust digital asset portfolio with confidence and enthusiasm. Cheers to smart, clear-cut financial strategies!
FAQ
What is market sentiment trends analysis?
Market sentiment trends analysis measures investors’ moods by reviewing news, social media chatter, and economic data. It helps reveal whether the market feels bullish or bearish, guiding potential buy or sell decisions.
What did market sentiment trends analysis show in 2022?
Market sentiment trends analysis in 2022 revealed shifts influenced by economic policies and tech developments. It highlighted how changing GDP and investor discussions shaped a mood of caution or optimism throughout the year.
What is market sentiment today?
Market sentiment today refers to the current mood of investors captured in real time through news, social media buzz, and economic indicators. This snapshot helps traders assess immediate market behavior.
What are market sentiment indicators?
Market sentiment indicators are tools like the VIX, NYSE High/Low index, and moving averages that measure investor mood. They provide a clear picture of market fear, breadth, and long-term trend shifts.
How does the market sentiment indicator on TradingView function?
The TradingView sentiment indicator combines technical data and investor chatter. It visually plots mood shifts, allowing traders to spot potential buying or selling opportunities based on current market energy.
Can you provide a market sentiment example?
A market sentiment example is when negative news triggers social media discussions and a rising volatility index. This alignment of data warns investors of possible price drops by reflecting a bearish mood.
What is a market sentiment website?
A market sentiment website gathers data from news feeds, social media, and economic updates to display a live snapshot of investor emotions. It serves as a quick reference for tracking mood shifts and market trends.
