
Ever notice how a trader's mood can kick off big market moves? When feelings run high or low, the number of trades often shifts too – much like checking the weather before you head out. A burst in trading can back a strong price move, while a low count might give you a heads-up to be cautious. In short, the market's vibe and trade numbers work together, sparking shifts that touch everyone. Let's dive in to see how these signals team up to fire off market trends.
Connecting Market Sentiment and Trading Volume: Core Relationship

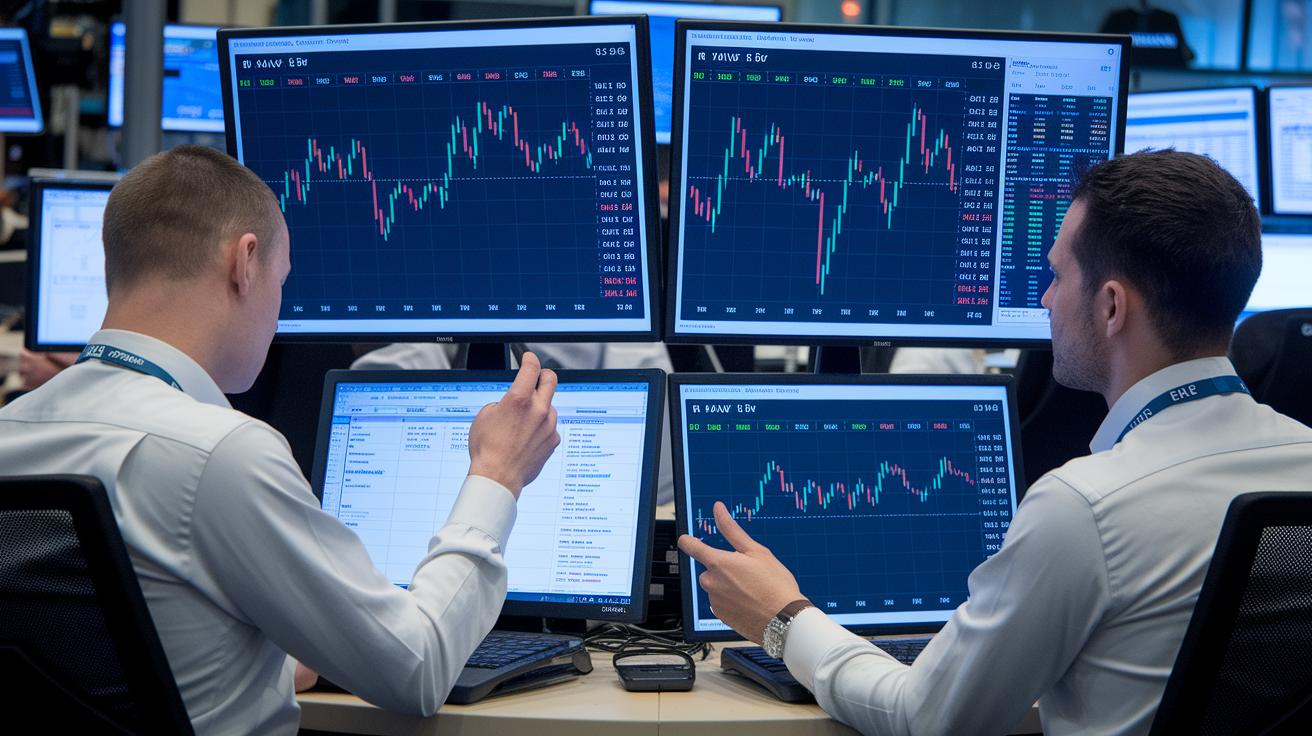
Market sentiment is like the everyday mood of traders – it shows up as either hopeful or gloomy about where prices might go next. It’s a bit like checking the sky before deciding if you need an umbrella. When a piece of exciting tech news breaks, traders often get a lift in spirits, which can lead to more buying.
Trading volume, on the other hand, is the simple count of how many shares or contracts are traded in a given time. Think of it as the market’s heartbeat. A strong heartbeat with high volume often signals real buyer confidence, while a weak pulse from low volume might not tell the full story.
Sometimes, traders get swept up in a really bullish or bearish mood. When that happens, it could be a hint that the market is about to change direction – though it’s not always a sure sign. High trading volume during a price move usually reinforces the trend, but if the volume is low, it’s a cue to be cautious.
In short, market sentiment and trading volume go hand in hand. As the collective mood shifts, changes in trading volume help investors understand how strong those market signals really are.
Quantitative Tools for Assessing Sentiment and Volume Dynamics
Traders mix several number-crunching methods to turn market mood and trading volume into handy signals. For example, On-Balance Volume (OBV) adds up trading volume on days when prices go up and subtracts it when prices go down. Think of OBV as a simple running total that shows if buying or selling pressure is building up.
Volume Weighted Average Price (VWAP) works in a similar way. It calculates an average price during the day based on how much was actually traded. In plain terms, VWAP checks if price changes are backed by strong volume, giving you a clearer picture of market strength.
The Commitment of Traders (COT) Report is another useful tool. It breaks down positions held by different trader groups, signaling shifts in how the market feels. Plus, survey-based sentiment indexes mix numbers from economic surveys with technical insights to capture the overall mood among market players. It’s like hearing both a loud cheer in a stadium and a gentle, excited murmur among fans.
| Indicator | Data Source | Calculation | Relation to Volume |
|---|---|---|---|
| OBV | Trading volume and price direction | Add or subtract volume based on price moves | Shows cumulative buying or selling pressure |
| VWAP | Intraday trading data | Weighted average price considering volume | Confirms trend strength with heavy trading |
| COT Report | Futures market positions | Compares professional and non-professional ratios | Highlights mood shifts that affect volume |
| Survey Index | Economic and market surveys | Creates a composite mood score | Explains volume spikes or lulls through sentiment |
Machine-learning models also blend news and social chatter to offer a dynamic picture, adding even more depth to these volume-based signals.
Illustrative Case Studies of Sentiment-Volume Interplay
Back in 2008, during the Financial Crisis, feeling gloomy spread fast, and many investors hurried to sell off assets. There was a clear spike in trading numbers, almost like a loud alarm signaling a deep worry. Picture this: the market's mood dipped so much that trading volume suddenly doubled as people rushed to get out.
In the last quarter of 2020, things looked up a bit, especially in the tech world. Trading volume for top tech ETFs jumped by 40%, driven by a more hopeful vibe. Price increases had strong support from this busy trading, showing that many investors were behind the upward movement.
Then, in May 2021, a crypto flash crash made things even more dramatic. Negative chatter on social media led to a steep 60% fall in Bitcoin prices. At the same time, trading volume shot up over 50% as traders quickly shifted away from confidence.
News about ESG (which stands for environmental, social, and governance, simple terms for companies' practices in social and environmental matters) also created clear patterns. After ESG-related updates, stock volumes typically rose between 20% and 30%.
Each of these examples shows how changes in overall mood can directly cause noticeable movements in trading volume.
Applying Sentiment-Volume Insights to Trading and Risk Management
Traders often combine tools like on-balance volume (OBV – a way to track buying and selling pressure) and sentiment indexes (that gauge market mood) to set clear entry and exit rules. Imagine a trader saying, "I use OBV to make sure a price move has real backing from buyers." In simple terms, if OBV climbs as prices rise, it adds confidence that the trend is solid.
Another smart move is scaling your position sizes. When you notice a surge in trading volume along with a noticeable shift in market sentiment, it might be the right time to invest a bit more. It’s like adjusting your sails when a fresh breeze catches, a small tweak can make the path smoother.
Using stop-loss orders that are linked to volume thresholds can also safeguard your trades when market conviction seems low. Picture it as setting a safety net; if the volume drops below a certain level, your stop-loss kicks in to help protect your portfolio from unexpected turns.
Mixing assets that show different market feelings is another effective risk-control tactic. This way, you avoid putting too much into one asset that might overreact to market emotions. For example, while one asset displays strong buying momentum, another might be more cautious, together they balance out the overall risk.
For those looking to dive deeper, detailed guides on digital finance risk management (tools that help assess financial uncertainty) and investment risk analysis tools (systems for evaluating market risks) can be very useful. Blending solid data with market sentiment creates a clear strategy, helping traders manage risks even in volatile markets.
Final Words
In the action, this article shows how shifts in investor mood drive trading volume and influence market moves. It breaks down key tools like OBV, VWAP, and survey indexes that measure the market sentiment and trading volume relationship.
Real-life examples highlighted how mood and volume changes signal confirmed trends and caution against false moves. Embrace these insights for sharper financial decisions and a robust digital asset portfolio. Positive trends lie ahead in your financial strategies.
FAQ
What does the market sentiment and trading volume relationship example (or PDF) show?
The market sentiment and trading volume relationship example shows how collective investor mood drives the number of trades. Detailed reports or PDFs often illustrate how optimism or pessimism influences market activity.
What does trading volume analysis (and its PDF) involve?
Trading volume analysis involves reviewing the total shares or contracts traded to gauge market strength. Analysts may refer to PDFs that detail methods and charts to confirm price trends with high activity.
What does the price-volume relationship, trading volume chart, and trading volume meaning indicate?
The price-volume relationship indicates how changes in volume support price moves. A trading volume chart visually displays this activity, while the term “trading volume” reflects how many shares or contracts exchange hands in a given period.
What happens when trade volume increases?
When trade volume increases, it shows that more market participants are active, reinforcing the current price move. This surge can signal stronger conviction behind a trend, both upward or downward.
What are the 90% rule in trading and the 7% rule in stock trading?
The 90% and 7% rules serve as quick benchmarks that signal extreme market conditions. They alert traders to assess when volume or price moves hit sensitive thresholds that might signal reversals or risk.
How does market sentiment affect the stock market?
Market sentiment affects the stock market by influencing buying and selling pressure. A positive mood tends to drive prices up with higher trading activity, while negative sentiment can lead to lower prices and dampened market enthusiasm.