
Have you ever stopped to think if your gut feeling guides your investment choices? Market mood sets how the whole market moves and can make us take bold steps even when numbers don’t call for change. It’s like a gentle wind steering a sailboat, sometimes it’s a soft push, other times it’s a strong gust. In this chat, we look at how feelings and moods can turn everyday trades into smart, confident moves. Paying attention to these vibes might just be the key to a smarter way of investing.
Market Sentiment and Investor Psychology Sparks Smart Moves
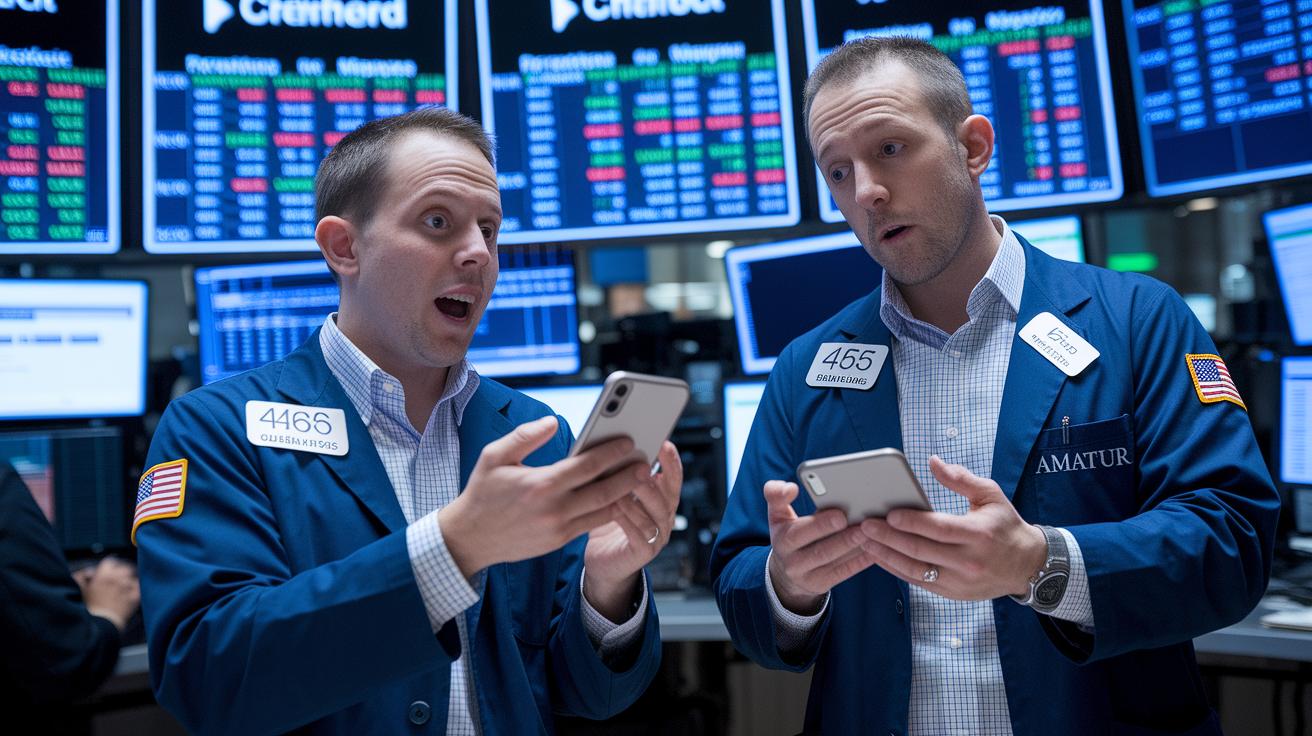
Market sentiment sets the mood for financial markets and influences how we all react to news and data. Sometimes, a mix of fear and greed can drive prices far away from what basic facts would suggest. I remember hearing how, before the tech boom, many underestimated the internet until a wave of optimism turned everything around. That shift in mood clearly shows how our feelings guide investment choices.
When confidence is high during bull markets, even pricey stocks can seem like a golden opportunity, tempting investors to take bigger risks. And when the market turns sour, panic can lead to rushed decisions. It turns out that trading isn’t just about numbers; it’s also about the emotions and moods that drive us.
These swings in sentiment often cause rapid price changes and a volatile market. In short, knowing how investors feel can be just as crucial as the raw figures. When you grasp how market sentiment works, you’re better equipped to adjust your strategies and navigate the ups and downs with confidence.
Foundations of Behavioral Finance and Investor Psychology

Behavioral finance mixes how people think about money with financial theories. It explains why investors sometimes stray from smart, logical decisions. Traditional theories, like the efficient market hypothesis (the idea that stock prices already show every bit of available information), assume that everyone acts logically. But in real trading, things rarely work that way.
Look at trading psychology. Investors often let their feelings override hard facts, leading them to make choices that don’t add up. This is where mental accounting comes in, treating money in different ways based on personal views instead of its true value. Imagine a trader who treats profits from one stock as separate from losses in another. Here’s a surprising fact: a trader fixated on a stock’s high from six months ago might ignore new signs of a downturn. This shows how anchoring bias (sticking to the first number you see) can really skew decisions.
There are other biases too. For instance, self-attribution makes an investor credit their wins to personal skill while blaming losses on outside factors. And then there are those wild emotional swings that come with market ups and downs. These quirks remind us that investing is more about human feelings than just cold, hard numbers.
Comparing behavioral economics with classic models makes it clear that our emotions can shake up the whole market when we stray from solid economic basics. By embracing these insights, we can read market signals better and adjust our strategies on the fly.
Common Behavioral Biases Affecting Investor Decision-Making
Sometimes, our feelings take over and cloud our judgment, even when the facts are clear. A common pitfall is when we judge money based on our past experiences instead of its true value. Imagine holding on to the memory of a stock’s high price like it’s a treasured photo, even when fresh market signals whisper that the trend might be shifting.
Then there’s the whole idea of following the crowd. When everyone seems to be buying or selling, it feels natural to jump in without a deep dive into the details. And we all know that sneaky confirmation bias, finding news that only backs up what we already believe while pushing aside anything that challenges our view. This kind of one-sided focus can trick us into thinking risks are smaller than they really are.
There’s also overconfidence bias, where believing you understand the market all too well nudges you into risky, speculative trades. Ever notice how recent events seem to loom large in your mind? That’s the availability heuristic in action, making fresh events seem more important in your decision-making process. And then there’s loss aversion: the fear of losing trumps the excitement of gaining, often pushing investors to sell too early during a downturn.
| Bias | What It Means |
|---|---|
| Anchoring bias | Sticking to an old price or past experience rather than current facts |
| Confirmation bias | Only seeking out info that agrees with your current beliefs |
| Herd mentality | Following the crowd without your own detailed analysis |
| Overconfidence bias | Overestimating your market knowledge and taking unnecessary risks |
| Availability heuristic | Giving too much weight to recent events when weighing risks |
| Loss aversion | Feeling more pain from a loss than pleasure from a gain |
Recognizing these biases is a key step in keeping a clear head during market ups and downs. It helps you adjust your strategy and make steadier, more balanced decisions, even when emotions start to run high.
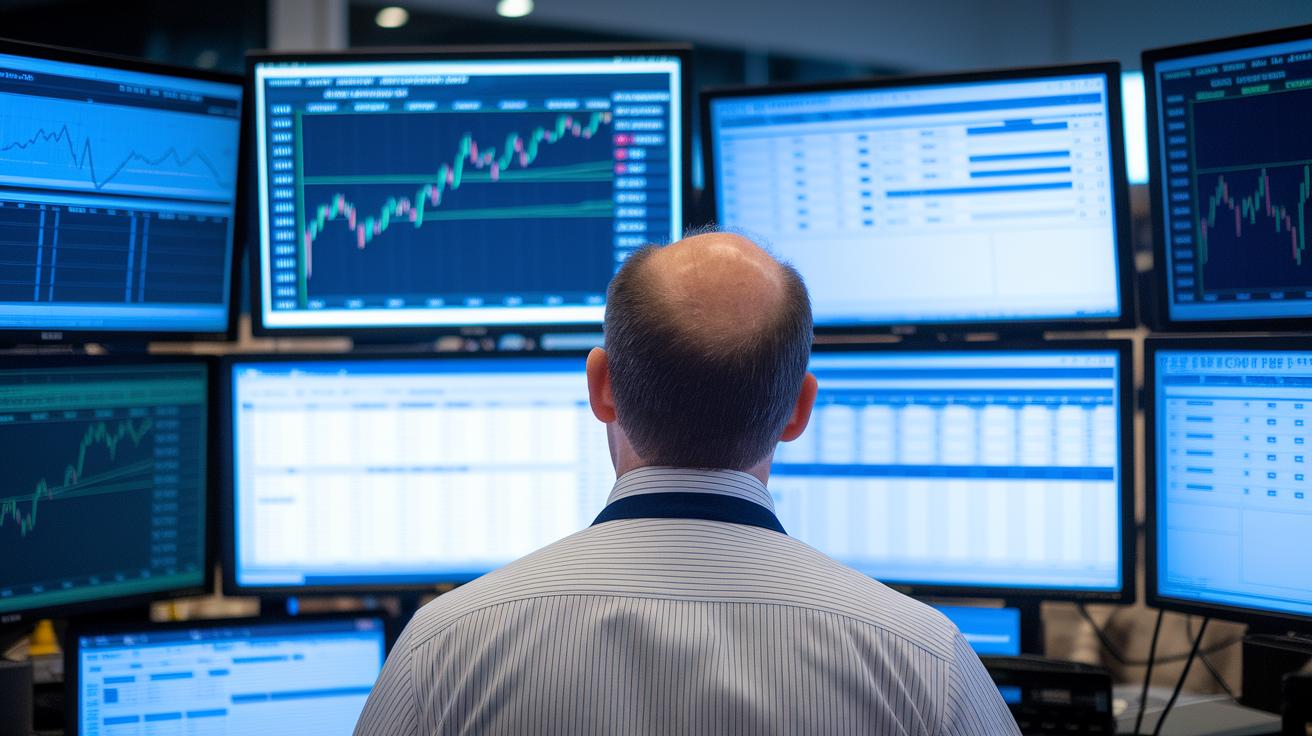
Measuring Market Sentiment: Key Indicators and Tools

Analysts have a set of practical tools to figure out what the market is feeling. One popular method is technical sentiment analysis. It uses indicators like On-balance Volume (OBV) as a straightforward way to add up trading volume and show if buyers or sellers are taking charge. If you want to dive even deeper, you might check out this helpful guide on volume price analysis. Another handy tool is Moving Average Convergence Divergence (MACD), which simply compares different moving averages to spot shifts in momentum, offering clues when prices may soon change direction.
Sentiment analysis goes further than just crunching numbers. It also taps into the vibe from news headlines and social media chatter, making it easier to see what investors are really thinking. By blending these insights with broader economic indicators, you get a clearer picture of whether fear or greed is in the driver’s seat. And when market moods flip quickly, these tools help investors spot if recent trends are backed by real trading activity rather than just a wave of emotion.
| Indicator | What It Measures | Typical Use Case |
|---|---|---|
| OBV | Cumulative buying or selling pressure | Confirming price breakouts |
| MACD | Shifts in momentum using moving averages | Spotting potential trend reversals |
| Fear & Greed Index | Overall level of fear or greed (scaled 0–100) | Timing trades by taking a contrarian approach |
In short, these tools allow professionals to gauge investor confidence and fine-tune their strategies as the market mood shifts.
Dot-Com Bubble: A Case Study in Sentiment-Driven Market Bubbles
Between 1995 and 2000, the Nasdaq rode a wave of pure excitement. Internet stocks turned into the crowd’s favorite, sparking a frenzy of bold, sometimes risky bets. The index shot up to five times its former value as investors, full of confidence, acted like a cheering crowd at a big game. One trader even said, "Every stock was a winner," showing how optimism can sometimes ignore the hard facts.
Then, almost overnight, everything changed. The same energy quickly turned to panic selling, and the Nasdaq dropped by almost 77% from its peak. This dramatic shift shows how fast feelings can change in the market, swinging from sky-high hope to deep fear. It's a powerful reminder that investor emotions, whether bursting with excitement or gripped by worry, can drive big moves that don’t always line up with the real numbers.
Strategies for Managing Emotional Trading and Enhancing Investor Decision-Making

You can really sharpen your investing skills when you learn to recognize what sets off your emotions. One simple trick is to keep a daily trading journal. Right after you make a trade, write down why you did it, how you felt, and give the mood a quick label. It’s kind of like tracking the weather to predict a storm. When you notice that same anxious feeling right before a downturn, it’s a good sign to step back and look at things more clearly.
Emotional Awareness Techniques
Start small with a few minutes of journaling each day. Right after each trade, jot down a short note like, “I felt really nervous during that sudden drop.” This extra step helps you see patterns in your behavior, much like unwrapping a gift to find what’s inside. And over time, you start to understand your impulses, making it easier to mix gut feelings with careful planning.
Contrarian Signal Deployment
There’s also a neat trick you can use when the market is acting extreme. When fear runs high, it might be a signal to consider buying, while too much cheer might mean it’s time to be extra cautious. Think of these signals like traffic lights on a busy road, sometimes you need to pause and check if the usual flow has shifted. Trusting these cues can help you avoid the crowd’s hasty moves and keep your strategy balanced.
Risk Management Frameworks
Finally, it helps to have a set of rules in place that keep your risks in check. Setting stop-loss orders and defining how much you’re willing to risk on a trade can save you from big mistakes driven by emotion. Using a checklist before finalizing any trade lets you review your decisions step by step. This method ties smart behavioral insights with solid risk controls, helping you stay calm and focused even when the market heats up.
Emerging Trends in Market Sentiment Analysis and Investor Behavior
Investing these days feels a lot like checking the weather, thanks to smart tools using artificial intelligence (computers that learn from data) and natural language processing (tech that understands everyday talk). They scan news stories and social feeds instantly, giving us a quick read on the market mood. Ever notice how online chatter sometimes hints at big changes before anyone else sees them?
Some funds now mix these mood scores into their number-based models. They pick up on small shifts, much like feeling a soft breeze before a storm hits, that may signal larger market moves later on.
By listening to what people share online, new insights into group behavior emerge. Machine learning tools follow these digital conversations and spot patterns that can lead to market ups and downs. In short, these fresh tools help experts navigate the natural flow of investor feelings, making market moves easier to understand.
Final Words
In the action, this post tied together market sentiment with investor psychology, showing how emotions shape asset choices. It broke down core behavioral biases and illustrated how tools like OBV and the Fear & Greed Index offer insights into market mood. The discussion covered practical steps such as structured checklists and risk management methods that help keep emotional trading in check. A deeper grasp of market sentiment and investor psychology can bring clarity and confidence, giving you a positive edge in optimizing your digital asset portfolio.
FAQ
What are market sentiment indicators, market sentiment today, and market sentiment analysis?
The market sentiment indicators reveal how investors feel by tracking trading volume, technical trends, and media tone. Famous tools include the Baker and Wurgler sentiment index and the Fear & Greed Index.
What is the 7% rule in investing?
The 7% rule in investing suggests that historical returns average around 7%. It offers a simple benchmark to gauge expected performance, emphasizing a long-term perspective rather than a precise outcome.
What is the market sentiment theory?
The market sentiment theory explains that overall mood among investors can drive price movements and market swings. It highlights that emotions and collective behavior sometimes overshadow fundamental analysis.
How does investor sentiment affect the stock market?
Investor sentiment affects the stock market by influencing buying and selling decisions. When optimism or fear dominates, prices may surge or fall sharply, reflecting the emotional bias of participants.
What is investor psychology?
Investor psychology studies how emotions and cognitive biases, like overconfidence and loss aversion, influence decision-making. It shows why market behavior sometimes deviates from strict financial fundamentals.