
Ever notice how investors' feelings can make your portfolio wobble? Market sentiment analysis picks up soft hints from trading floors, news headlines, and online chatter to create a clear picture of the market's mood.
This approach isn’t just about cold, hard numbers. It brings out the human side of finance and offers useful clues for smart moves.
In this article, you'll learn how spotting these signals can help guide wiser investments and spark better financial decisions.
market sentiment analysis Sparks Smart Financial Moves

Market sentiment analysis is like taking a snapshot of how investors feel about a particular asset, market, or financial tool. It goes beyond numbers on a chart by adding that human touch, understanding raw data through the lens of emotion.
This method picks up on clues from various sources. It looks at technical chart signals, which are visual hints from past price movements; macroeconomic indicators, telling us about the big picture; news and media stories; and even discussions in social media and online forums. These elements together reveal the mood of the market.
Sentiment analysis works best when paired with technical studies and fundamental reviews. Think of it as combining reliable facts with the natural pulse of investor feelings. This blend helps spot when the market is overly optimistic or overly cautious.
Different slices of sentiment analysis, like crypto sentiment analysis (for digital currencies), stock sentiment APIs (tools that compute stock moods), and hedge fund sentiment analysis, bring tailored insights for various asset types. By mixing these perspectives, professionals can understand market moves today and get hints about what might be coming tomorrow.
Market Sentiment Analysis Indicators and Measurement Techniques
It takes a mix of different signals to truly capture how investors are feeling. No single measure can show the whole picture, so each tool – whether it's a gauge of price wiggles or a look at what people are saying online – adds its own important detail to the story. By bringing these pieces together, you get a clearer view of the market and avoid the risk of leaning on just one signal.
| Indicator | Type | Data Source |
|---|---|---|
| VIX | Volatility Index | Options Market |
| NYSE High/Low | Breadth Indicator | Exchange Data |
| 200-Day MA | Trend Indicator | Price Charts |
| Social Media Sentiment | Qualitative Score | Twitter, Reddit |
| News Sentiment Index | Text Analysis | News Feeds |
Seeing extreme readings on these indicators can really point you toward the next steps. For example, if the VIX climbs unusually high, it might mean that traders are feeling a surge of uncertainty. Also, if you see strange shifts in the 200-day moving average or in other breadth signals, it could be a hint of a market top or bottom.
When you line up these technical charts with softer signals like social media chatter, you start to see moments when the market feels too optimistic or overly cautious. This mix of number crunching and gut feeling helps investors spot when the market might change direction, making it easier to decide when to adjust their strategies. In short, keeping an eye on a variety of data lets both big institutions and individual investors base their decisions on a well-rounded view of the market’s mood.
Market Sentiment Analysis Data Sources
When we talk about market moods, qualitative sources are our first stop. News sites, social platforms, and narrative analysis let investors feel the heartbeat of everyday market chatter. When headlines report surprising events or a company’s changing outlook, these stories quickly spread on social media and online forums. They capture the excitement of a strong rally or the caution that comes during a downturn. It’s like hearing friendly conversations at a bustling local market that bring the human side of finance into view.
On the other hand, economic indicators offer a calm, steady look at market sentiment. Measurements like GDP growth, unemployment rates, and inflation give us easy-to-understand signals about economic health. And then there are trading details like exchange data and market breadth numbers that help track how money is moving. OSINT tools (open-source intelligence tools that gather information from public sources) collect both real-time and past data, turning huge streams into smart, practical insights. By mixing these solid figures with the softer qualitative signals, we get a complete picture of public sentiment, business confidence, and even capital flow trends. Advanced tools like big data analytics (technology that quickly sorts and makes sense of lots of information) take our trend tracking to the next level.
Market Sentiment Analysis in Digital and Cryptocurrency Assets

Crypto markets move fast, and knowing how investors feel can really help you decide your next move. This kind of analysis lets traders feel the pulse of the market and better manage risk when dealing with digital assets.
Data on investor mood comes from both on-chain numbers (that is, the secure record of all crypto transactions) and everyday social chatter. Tools scan Telegram groups, Twitter feeds, and online forums to find clues in trader discussions. Crypto-specific software picks up signals like big investor moves, sudden bursts of online talk, and overall sentiment scores. Think of it as a mood ring for digital currencies that mixes clear numbers with human chatter to predict potential price swings.
Imagine a case where a wave of positive chat on a well-known crypto forum hinted at an altcoin rally. Traders noticed a quick surge in mentions and upbeat discussions about that coin and used this signal to time their entry. In short, using this kind of sentiment analysis turns raw social data into smart financial moves, offering timely insights into market direction.
Algorithmic Models and Machine Learning in Market Sentiment Analysis
There are two main ways to score sentiment. One uses set rules and word lists, while the other relies on computers learning from data to sense the market's mood. In simple terms, rule-based methods use pre-made dictionaries of words to add up a score, and machine learning methods study past conversations to guess how investors feel.
Rule-Based Sentiment Scoring
Rule-based tools like VADER and LIWC work with carefully chosen word lists. They assign a small score to each word, and traders then add these scores to capture the overall sentiment of a text. Traders even tweak these dictionaries to match the slang of finance. For example, a word that sounds positive in everyday talk might actually signal a sudden change in the market.
Machine Learning Models
Machine learning models, like Naive Bayes or LSTM, learn from past market chatter. Think of LSTM as a special kind of computer program that remembers patterns, much like how we remember favorite tunes. These models are tested with numbers like accuracy, precision, recall, and F1 score to make sure they’re predicting the market mood correctly. Still, the language of finance can change quickly, so models need regular updates to keep up with new trends.
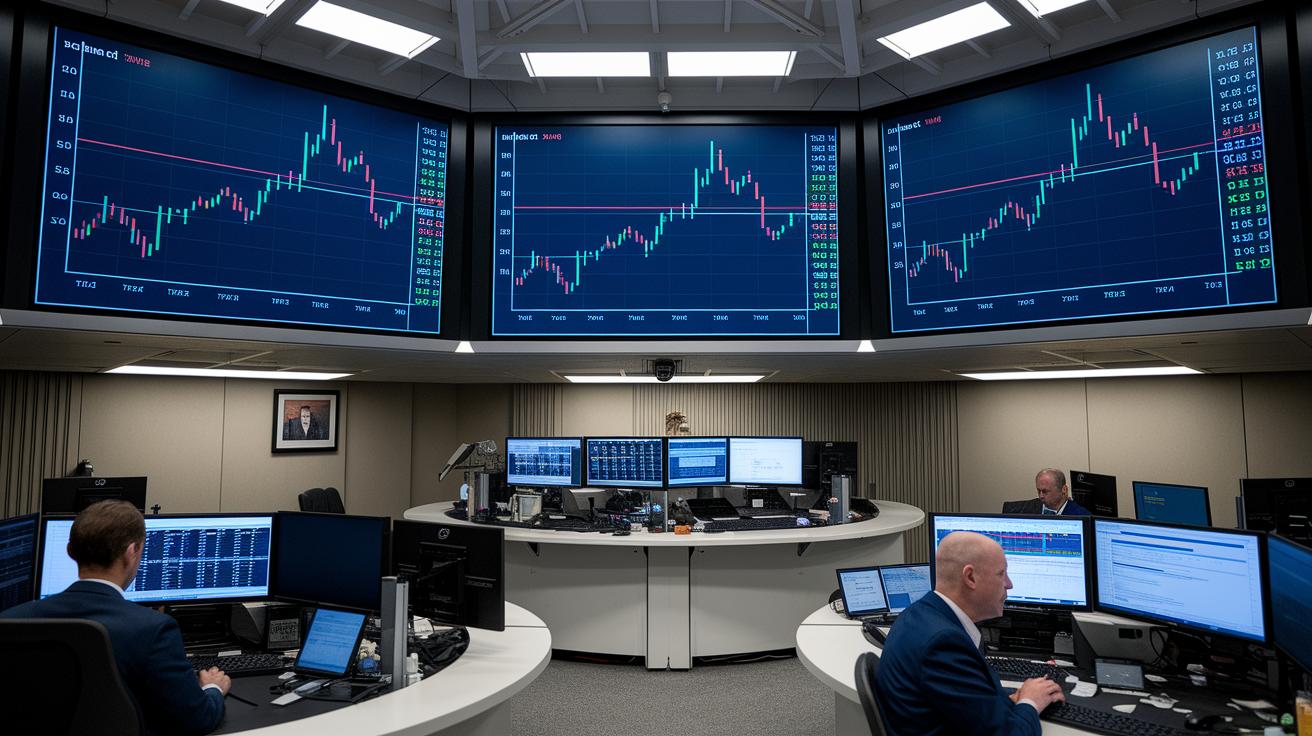
Visualizing Market Sentiment Analysis Trends

Time-series charts, heatmaps, and interactive graphs help us see the market’s mood in a simple way. They turn complex sentiment scores into clear, visual signs that anyone can understand. For example, a time-series chart might show you a sudden change in mood while a heatmap highlights the sectors where investor activity is high. Picture a chart pulsing like a heartbeat, giving traders hints about how market feelings might be shifting. These visual tools make it easy for both beginners and experienced investors to quickly grasp what’s going on and make smart financial moves.
Interactive dashboards add another layer of insight by showing real-time updates, built-in alert systems, and side-by-side sector comparisons, all on one screen. A mood analytics dashboard might flash red when sentiment dips or trigger alerts during sudden market shifts. This setup lets you keep an eye on trends at all times, so you can adjust your strategy promptly. In short, these clear visual interfaces transform raw data into practical advice, making the world of sentiment analysis both accessible and engaging.
Final Words
In the action, we explored how market sentiment analysis guides digital investors through both traditional and crypto markets. The outline walked through core concepts and the vital role of data sources, measurement techniques, algorithmic models, and visualization trends. It’s a reminder that combining various insights can help secure smarter, diversified investments in digital finance. Every piece of data has a story, and together, they create a clearer picture of market mood. Stay positive and keep an eye on the steady pulse of market sentiment analysis.
FAQ
What is market sentiment and what does it mean for today?
The market sentiment reflects the overall mood of investors, showing current attitudes toward assets. It combines insights from economic data, news, and social media to indicate optimism or pessimism.
How do you analyze market sentiment?
Analyzing market sentiment means examining technical chart signals, economic data, news narratives, and social media discussions. This mix of factors helps gauge whether investors feel positive or negative.
What are common market sentiment indicators and how can TradingView assist?
Common indicators include the VIX, NYSE High/Low, and the 200-day moving average. TradingView provides interactive charts that display these signals to inform you about shifts in investor mood.
Is free market sentiment analysis available with charts and websites?
Yes, free tools and websites offer market sentiment analysis with charts that compile data from news outlets and social platforms, helping investors easily monitor current market moods.
What is the best market sentiment indicator?
The best indicator can vary by context. Combining several measures—like the VIX, qualitative news metrics, and social media data—typically yields a more reliable picture of investor sentiment.
Can I use ChatGPT for sentiment analysis in a market context?
ChatGPT can help evaluate the tone of news and social discussions, offering qualitative insights. It works best when used alongside dedicated quantitative tools for a full market view.
What is the 3-5-7 rule in the stock market?
The 3-5-7 rule offers a timeframe guideline for monitoring market moves, helping traders assess short-, mid-, and longer-term trends to make timely decisions during shifts in stock prices.