
Ever notice how a small change in how investors feel might hint at big shifts in the market? When things feel a bit shaky, keeping an eye on market mood can help you spot new chances right away.
Think of it like watching the clouds for signs of rain. By tracking key numbers and listening to the stories behind them, you get clues about what might come next in the market.
Studies show that surveys, options data, and even the tone of the news can give you a clear picture of investor feelings. In this article, we’ll break down easy ways to read market sentiment, even in uncertain times, and show you how these insights can lead you to promising opportunities.
Interpreting Market Sentiment in Uncertain Times: Bright Prospects

Market sentiment really shapes how stocks move, almost like the mood swings of a person. Researchers like Roman Frydman and his team have shown that using surveys, options flows, and story-focused analysis can help us understand these mood changes. Think of it this way – just as dark clouds can signal rain, a sudden rise in investor gloom might hint at rough times ahead.
Quantitative methods are a smart first step. For instance, consumer confidence surveys tell us how shoppers feel about the economy. Meanwhile, the VIX, which measures investor fear (basically how scared or calm they are), works like a pulse check on the market. Tracking changes in trading volume with tools like put-call ratios and ETF flows also helps us pick up on shifts in risk levels. For a handy list of these metrics, check out market sentiment indicators (https://gotocryptos.com?p=1296).
Qualitative techniques add even more depth. News-tone analysis, for example, goes through headlines to capture the overall mood, condensing tons of articles into one clear picture. Social media sentiment, gathered from places where traders share their thoughts, offers real-time feelings about the market vibe. Imagine sorting through thousands of posts that together create a continuous hum of digital chatter – every post adds a bit to the big picture.
Bringing together all these numbers and stories gives you a strong, data-driven look at the market, even when things feel shaky. For example, if you see a rush of negative news along with dropping consumer confidence, it’s a good cue to be cautious, almost like noticing a change in the wind before a storm. If you’re new to this, you can learn some basic techniques to read market sentiment (https://nftcellar.net?p=1402). These straightforward ideas can help you get a balanced feel for the fast-changing market world.
Key Quantitative Indicators for Measuring Sentiment Amid Economic Turbulence

We watch investor moods through a mix of simple numbers that work like early warning lights during shaky times. For example, surveys like the Consumer Confidence Index give us a clear peek into how buyers and sellers are feeling about the economy. It’s much like checking the temperature on a chilly day, finding out if optimism or worry is taking hold.
Then there’s options data, often shown as the put-call ratio (a tool that compares how many betting options are for protection versus bold investments). Picture a balance scale: when it tips, it means many investors are leaning toward safety rather than taking big financial risks.
Next up is the VIX, an indicator that measures market fear. In November 2008, the VIX shot up past 80, like a bright red billboard warning of fast market shifts. ETF flows tell us when big sums are moving between various funds, hinting that people’s appetite for risk might be changing. And credit spreads, these compare interest rates on different bonds to show how much extra cost borrowing has during tough times, tend to widen when uncertainty is in the air.
For more details on how these numbers help us understand market risks, check out the risk assessment definitions at this link: https://dealerserve.com?p=1136. Researchers like Frydman and his team have noticed that jumps in inflation-related sentiment can sometimes signal upcoming stress in regional banking. All these numbers together help us piece together shifts in market mood, offering a clear snapshot of risk appetite when times are uncertain.
Qualitative Methods for Market Sentiment and Psychological Insights During Volatility

Studies from leading economic groups show that getting a read on investor mood goes far beyond crunching numbers. Talking with experts, hosting small focus groups, and examining stories let us uncover how traders really feel when the markets get shaky. These methods also reveal how people’s habits, like being overly confident (thinking too highly of oneself), following the crowd, or fearing losses, can lead to risky choices when the market stumbles.
Take this example: an expert interview can show that a trader’s overconfidence might push them into taking too many risks before a downturn. One trader even said, "I once noticed that a quiet trading floor meant that loss aversion (worry about losing money) was about to kick in full force." Such firsthand stories add a human touch to how we understand market moods and help track emotional highs and lows during turbulent times.
Listening to focus groups lets analysts hear a range of ideas on how people see uncertain news and market signals. Meanwhile, narrative analysis, where we dig into media stories and investor opinions, helps spot shifts in tone and confidence. Together, these methods show the little details that reveal when feelings stray from solid economic facts during a crisis.
Key tools in this approach include detailed discussions, surveys, and reviews of investor comments. For more on how these psychological factors shape decisions, check out market sentiment and investor psychology (https://nftcellar.net?p=1532).
- Expert Interviews
- Focus Groups
- Narrative Analysis
In short, these methods give us a full picture of investor emotions, enriching our grasp of market moves even when times get wild.
Case Studies: Sentiment Shifts During Recent Economic Crises
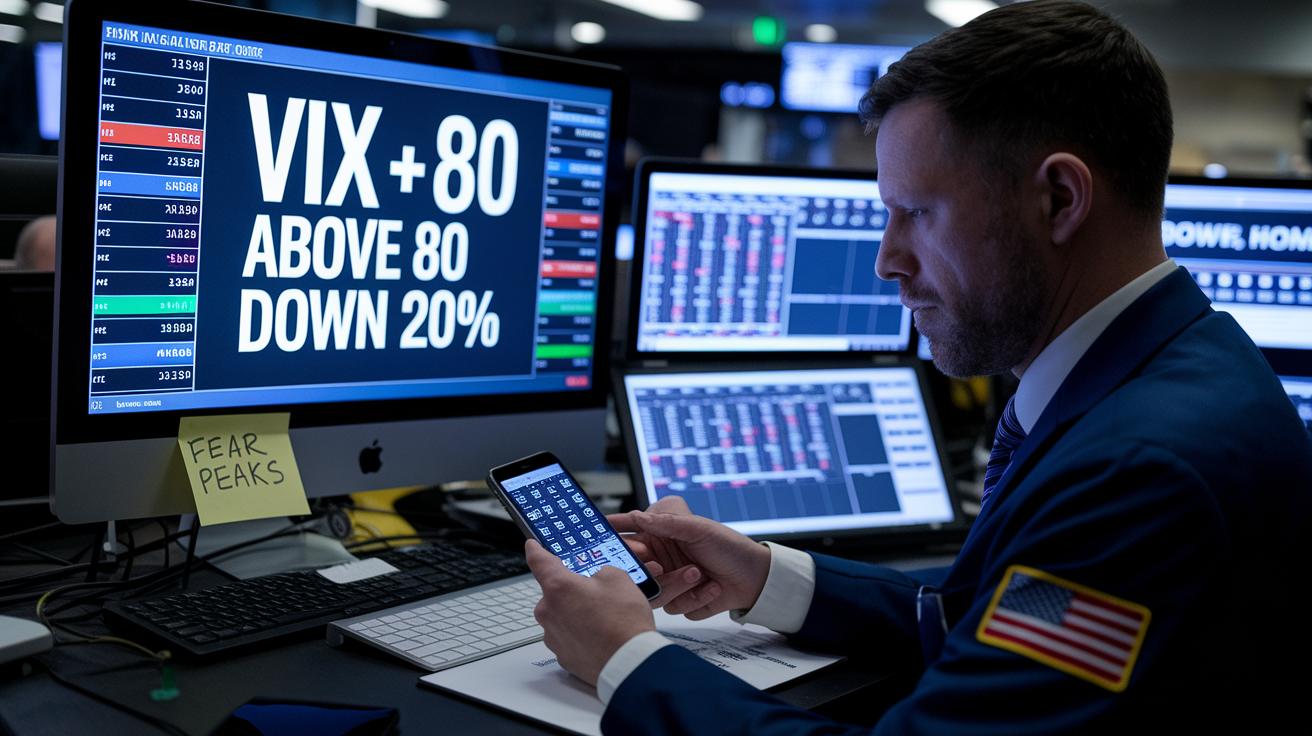
When we look at wild moments in the market, we see that shifts in investor feelings can act as early signals of big changes. Back in 2008, for example, the market took a steep dive as fear spread among investors. Imagine reading a note that says, "When fear reaches its peak, even solid stocks can tumble." At one point, the VIX (a gauge that tells us how nervous investors are) soared above 80 while the S&P 500 (a key measure of stock performance) dropped 20% in just one week. It really shows that when emotions run wild, even the sturdier stocks can suffer.
More recently, during the COVID-19 selloff in March 2020, similar patterns emerged. The VIX hit 82.7 and the University of Michigan Sentiment Index (a tool that measures how optimistic or pessimistic consumers are) fell sharply from 101.4 to 71.8 in only one month. This clear dip reminds us that these sentiment numbers can serve as a warning sign, reflecting the intense emotions at play during economic shocks and helping guide financial moves as conditions start to get better.
| Indicator | Peak Reading/Movement | Market Impact | Recovery Timeline |
|---|---|---|---|
| VIX | Above 80 | S&P 500 fell 20% in one week | Prolonged recovery over several months |
Likewise, the COVID-19 selloff shows us how these numbers can shift suddenly:
| Indicator | Peak Reading/Movement | Market Impact | Recovery Timeline |
|---|---|---|---|
| VIX | 82.7 | Sharp fall in market sentiment | Rapid rebound followed by volatile adjustments |
| University of Michigan Sentiment Index | Dropped from 101.4 to 71.8 | Indicative of weakened consumer confidence | Recovery gradual as uncertainty eased |
These cases remind us that keeping an eye on how investors are feeling can offer real clues to when the market might change its course.
Integrating Sentiment Analysis into Risk Management and Portfolio Strategies
Many firms have managed to cut their losses by up to 15% when they scale back their positions as market fear, indicated by tools like the VIX (a gauge of how shaky the market feels), reaches a certain level. Think of it like watching your car’s speedometer; if you see the needle pushing too high, you ease off the gas. This little check on market mood can steer decisions that build sturdier portfolios.
One smart move is to run stress tests that mimic rapid drops in market optimism. These tests work just like rehearsals before a storm, letting managers check if their plans can hold up when things get tough. If key confidence numbers fall below a set mark, portfolio managers start lowering their exposure bit by bit. This method, often called volatility scaling, means that investments adjust to match how investors are feeling at that very moment.
Momentum filters also come into play by tracking real-time trends and spotting shifts early on. It’s like tuning into a crowd’s reaction at a live event, if the vibe sours, funds can be moved to safer spots. At the same time, hedging rules serve as safety rails. When market sentiment turns chilly, these rules point the way for defensive moves. One manager described it as, "When the market starts showing fear, it’s like dark clouds rolling in; a right hedge acts like a protective umbrella."
By blending stress tests, careful adjustments based on market volatility, and solid hedging rules, portfolio managers create a flexible system that reacts quickly to sudden mood shifts. This ongoing check on investor sentiment means portfolios can adapt fast when economic conditions become unpredictable.
Emerging Tools and Technologies for Real-Time Sentiment Surveillance
Modern technology is changing the way we see investor moods, especially in uncertain times. New platforms use natural language processing (NLP, which helps computers understand human language) and social media analytics to scan thousands of posts, much like reading the vibe of a busy room. Options-flow algorithms and macro-event scanning work together to create dynamic sentiment dashboards where every market whisper is captured and shown in real time.
These systems come with API sentiment feeds (automated data streams that update continuously) that quickly alert users to sudden mood shifts. For instance, a portfolio manager might get an alert if online chatter starts to sound pessimistic, giving them time to adjust their strategy. Dashboard tools display these trends clearly, similar to watching a live weather map where each color change hints at a shift in market temperature.
Researchers and community experts are pooling their ideas to build better, custom-made models and open-source indicator libraries. This teamwork connects raw data to practical insights, helping investors and risk managers make timely decisions.
- Detection systems pick up even brief, significant mood swings
- Visualization tools offer a quick view of how the market feels
- Quantitative mood indicators deliver clear numbers to support important choices
These modern tools allow investors to monitor sentiment with great accuracy, even when the market feels a bit unpredictable.
Final Words
In the action, this article highlighted several key methods for interpreting market sentiment in uncertain times. It reviewed both the numbers, like survey data and volatility gauges, and the emotions captured by expert narratives. Short case studies showed how sentiment can drive market movements during shock events. The discussion also touched on how new tools can offer real-time insights for better portfolio decisions. There's genuine promise in these practical, data-driven approaches to keep investors one step ahead. The future of digital investments looks bright.
FAQ
What insights does a PDF on interpreting market sentiment in uncertain times offer?
The PDF explains how to gauge market mood during turbulent periods by combining data from surveys, volatility measures, and news analytics, helping investors adjust risk management strategies with clear, actionable insights.
What are market sentiment and investor psychology and how do they influence trading?
Market sentiment reflects the overall mood of investors, while investor psychology covers their behavioral biases. Together, they shape price trends and risk appetite, influencing trading decisions and market dynamics.
What is the Bullish Sentiment Index?
The Bullish Sentiment Index gauges investor optimism by tallying positive market views, offering a numerical snapshot of market confidence that helps signal potential trends and shifts in risk behavior.
How can you find market sentiment in forex trading?
In forex markets, sentiment is measured by monitoring technical indicators, social media buzz, and real-time news. These cues collectively signal shifts in trader behavior and risk appetite across currencies.
What is the 3-5-7 rule in the stock market?
The 3-5-7 rule is a guideline for assessing short-term price movements by examining market trends over three, five, and seven-day periods, offering a simple framework to manage trading risks.
How often does a 20% market correction happen?
A 20% market correction is a rare event, typically unfolding over several years rather than weeks or months, making its occurrence infrequent and often linked with broader economic shifts.
How can you measure market uncertainty?
Market uncertainty is measured using tools like volatility indexes, consumer sentiment surveys, and credit spread analysis, which together provide a clear picture of the shifting risk environment and investor concerns.