
Ever thought about whether gold still stands strong during unpredictable times? Right now, gold is priced around $3,656 per ounce, and it’s been on an upward swing throughout the year.
Many experts believe that cheaper borrowing rates could push these prices even higher. That makes gold a smart choice for anyone looking to protect their savings.
In short, this post dives into the trends behind these rising numbers and explains why more investors are finding comfort in gold’s steady performance as a reliable investment option.
Gold Market Trends Inspire Confidence

Gold’s current spot price stands at $3,656 per ounce as of September 15. That’s a solid gain of 41.8% this year and an increase of $1,600 since the beginning of the year. This performance is making investors feel secure and drawing people who are looking for safe bets. Some investment banks even say gold could reach $5,000 per ounce if the economy slows down and investors move away from U.S. Treasury bonds.
Experts take a cautiously upbeat view. They expect gold might stabilize around $3,750 by the end of 2025 if interest rates are lowered. With whispers that the Federal Reserve might cut rates soon, many buyers see today as a golden opportunity to add this asset to their portfolios. They’re really paying attention to the clear trends in gold prices, which look different from the ups and downs of stocks and bonds. (See current market trends for a side-by-side comparison.)
| Metric | Value |
|---|---|
| Spot Gold Price | $3,656 per ounce |
| Year-to-Date Gain | 41.8% |
| Absolute Rise | $1,600 |
There’s a steady buzz of buying interest behind these numbers. It all points to a strong and resilient outlook that is giving investors a lot of confidence as they plan their next steps.
Historical Perspective on Gold Market Trends
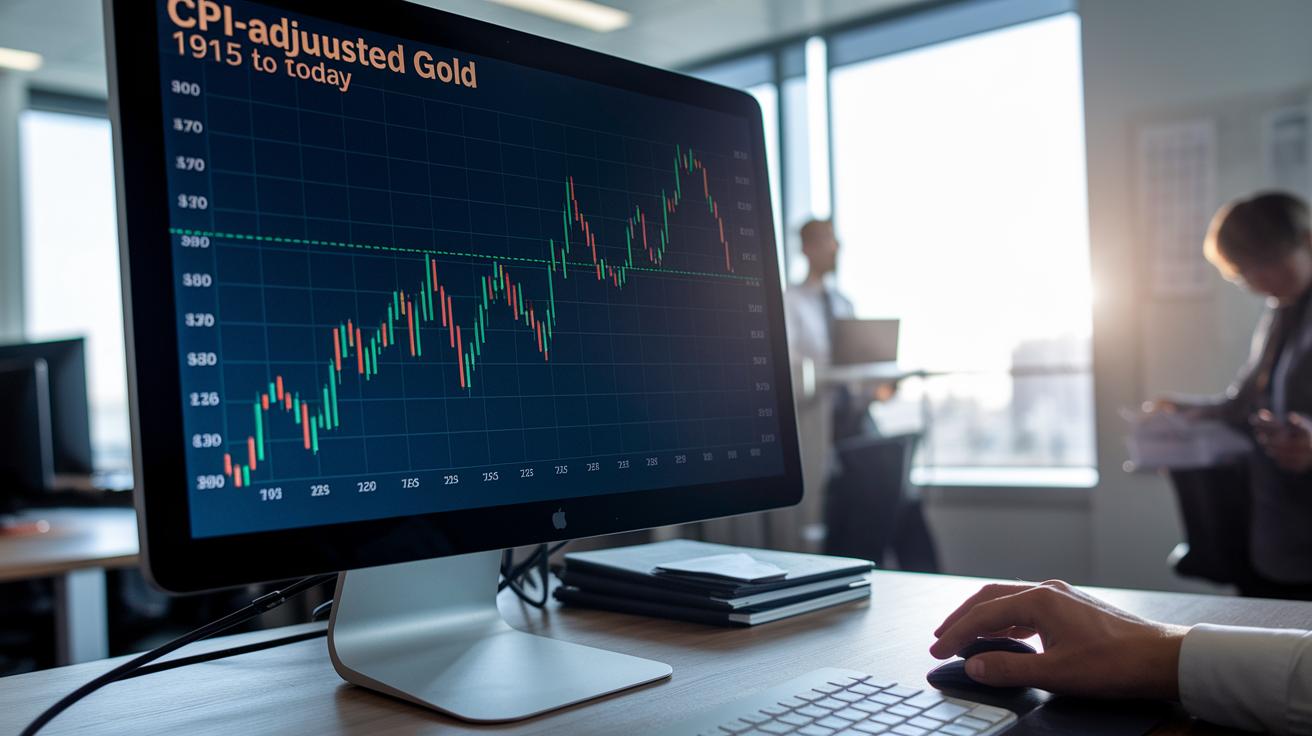
Gold has been around for over a hundred years, and its price changes tell us a lot about different economic moods over time. The chart, which starts back in 1915, adjusts prices using the Consumer Price Index (a tool that tracks changes in the cost of everyday goods) so it’s easier to see gold’s performance despite shifts in buying power.
A standout moment was during the 1970s oil shock. During that time, gold prices soared dramatically, shaking up how people thought about investments and showing that hard assets often shine when the economy and politics get rocky.
Today, the chart updates every hour. That way, investors always have the freshest data, and if you want to dive deep into long-term trends, the complete dataset is right there for you.
By looking at over a century of data, we can see that current market trends aren’t new, they are part of a long, fascinating economic story. Isn't it interesting how these historical shifts shape what we see today?
Economic & Geopolitical Drivers Shaping Gold Market Trends

Rising government debt makes investors rethink gold as a safe bet. When debts pile up, people start doubting whether traditional safe investments can be trusted. Gold becomes especially appealing even when interest rates remain high because the usual links between gold’s success and national rates get a bit murky.
Inflation also has a strong impact on gold prices. When everyday costs rise, it shows that money isn’t holding its value well. In these times, many turn to gold to help protect their spending power. There’s a clear connection between rising prices and the growing demand for gold.
Central banks play a big role too. For example, when the Federal Reserve hints at lowering rates, it builds more trust in gold as a stable asset. This kind of policy change even influences the way experts forecast trends in the market.
All in all, the combination of high government debt, inflation pressures, and central-bank moves is changing how we see risk. The market is adapting, and old safe-haven strategies are being rethought in light of these shifts.
Technical Analysis & Forecast Models for Gold Market Trends
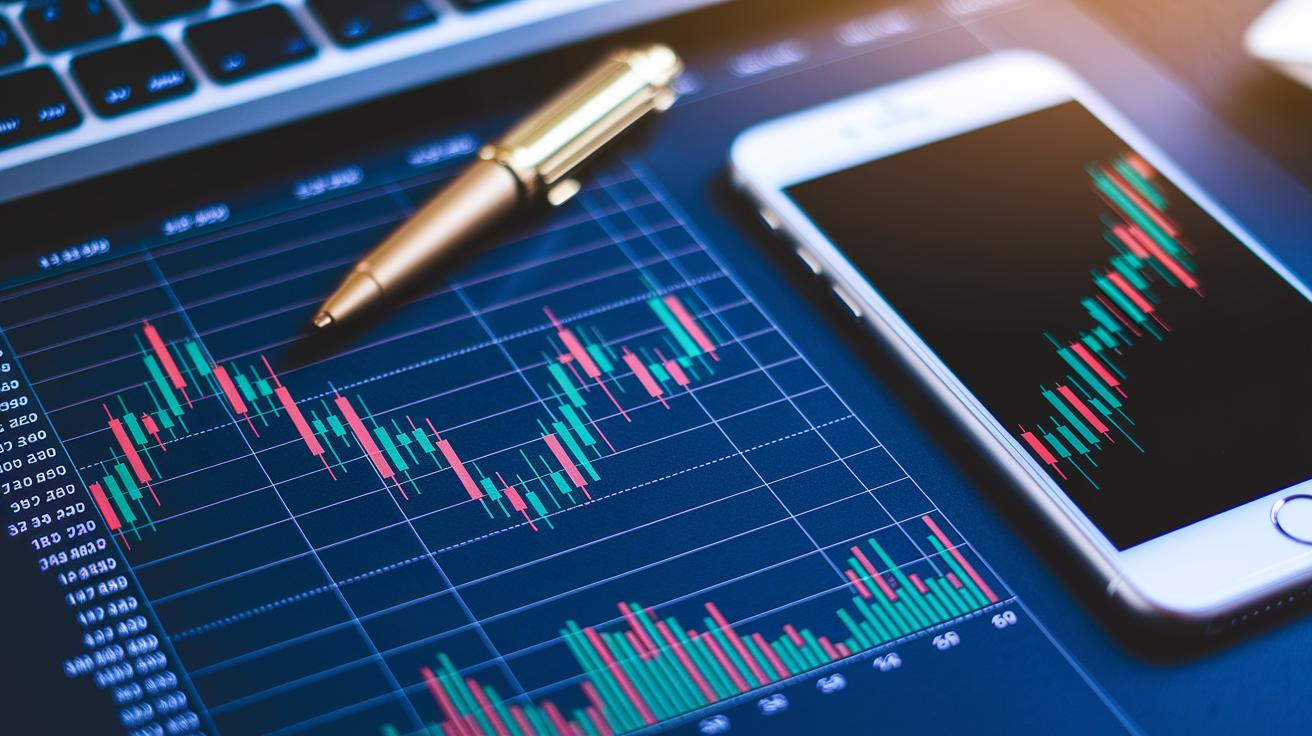
Analysts often lean on straightforward tools like moving averages (a way to smooth out price changes over time), RSI (Relative Strength Index, which measures how fast and how much prices move), and trend-line breaks that mark when the gold market might be about to flip direction. These techniques help investors pinpoint the moments when gold prices might shift, giving a clearer picture of the daily ups and downs. For instance, did you know that daily candlestick patterns can sometimes hint at short-term reversals even before the broader market shows any signs? This early clue, detailed in resources like Technical Analysis Chart Patterns (https://tradewiselly.com?p=427), often signals that a change in the market's tide might be coming.
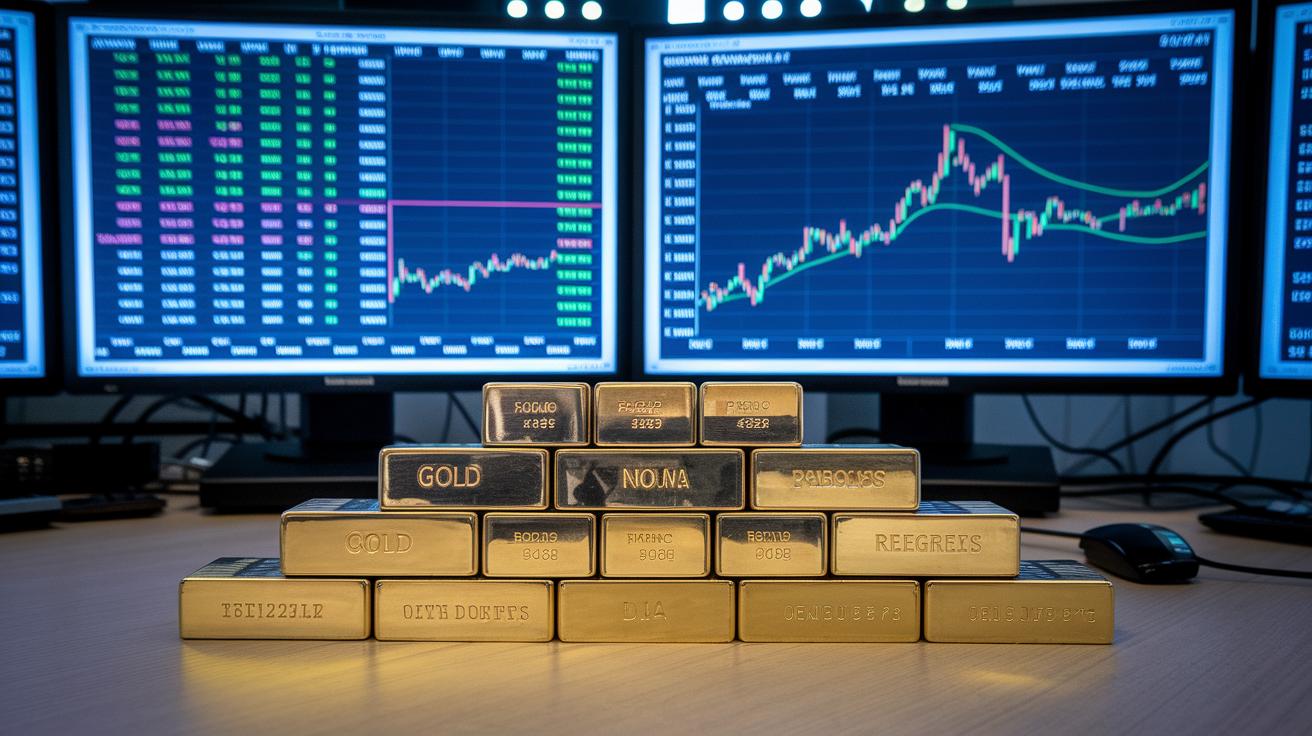
Forecast models also play a big role when trying to see where gold is headed next. Analysts use methods such as regression analysis (which examines how different data points relate to each other) to suggest that gold could settle around $3,750 by the end of 2025 if things run as they are. They also run scenario simulations, which factor in things like economic slowdowns, to estimate that during tougher times, gold might hit about $5,000 an ounce. These forecasting models help traders be ready for both steady trends and sudden market surges.
Some key signals investors keep an eye on are:
- Trends in moving averages to track price signals
- Candlestick patterns that show daily price movements
- Shifts in RSI that signal changes in momentum
By mixing clear technical analysis with reliable forecasting models, investors can make smarter decisions. Regularly checking these technical signals offers real-time insights that tie in well with broader market trends. In short, even if gold prices can sometimes seem unpredictable, these combined approaches help traders choose the right moments to jump in or take a step back.
Real-Time Tracking & Short-Term Variations in Gold Market Trends
Gold prices refresh every hour on big trading platforms, giving traders a real sense of the market's rhythm. This up-to-the-minute view matters because even a tiny shift can be a hint of bigger changes. Think of it like noticing a slight breeze before a sudden gust.
For example, a small drop in live gold rates might follow an unexpected economic update, just like dark clouds signal an incoming storm. I remember one time an unanticipated CPI report nudged gold prices upward in a flash, sparking alert among traders about possible shifts ahead.
Short-term changes usually sync up with U.S. economic events such as CPI (a measure of price changes over time) and jobs data, along with movements in currencies. Traders rely on live charts to spot these early signs, including:
- Keeping an eye on hourly gold rate charts
- Watching for trends during major economic announcements
- Checking how shifts in currency values are affecting gold prices
These simple tools help traders act quickly on daily fluctuations and plan their next move with confidence.
Long-Term Outlook & Expert Predictions for Gold Market Trends to 2030 and Beyond
Imagine this: if inflation stays steady, experts think gold could reach about $4,200 by 2030. And if our national debt keeps growing while the U.S. dollar loses its grip, gold might even top $6,000 by 2050. It’s all about how interest rate changes send ripples through the market. Really, when rates drop even a little, gold's charm as a safe asset can spike, just like a sudden gust of wind alters a sailor's direction.
Key ideas shaping these predictions include:
- The tug-of-war between inflation and gold’s role as a secure choice.
- The impact of rising government debt on how investors feel.
- How tiny shifts in interest rates can prompt quick moves in the market.
Industry insiders remind us that while these targets sound exciting, the road ahead is always changing. One expert even noted that gold’s future is as lively as it is promising. Keeping an eye on long-term trends and trusted insights can help investors set up their portfolios to handle both risks and big opportunities.
Key Risk Factors & Investment Strategies in Gold Market Trends

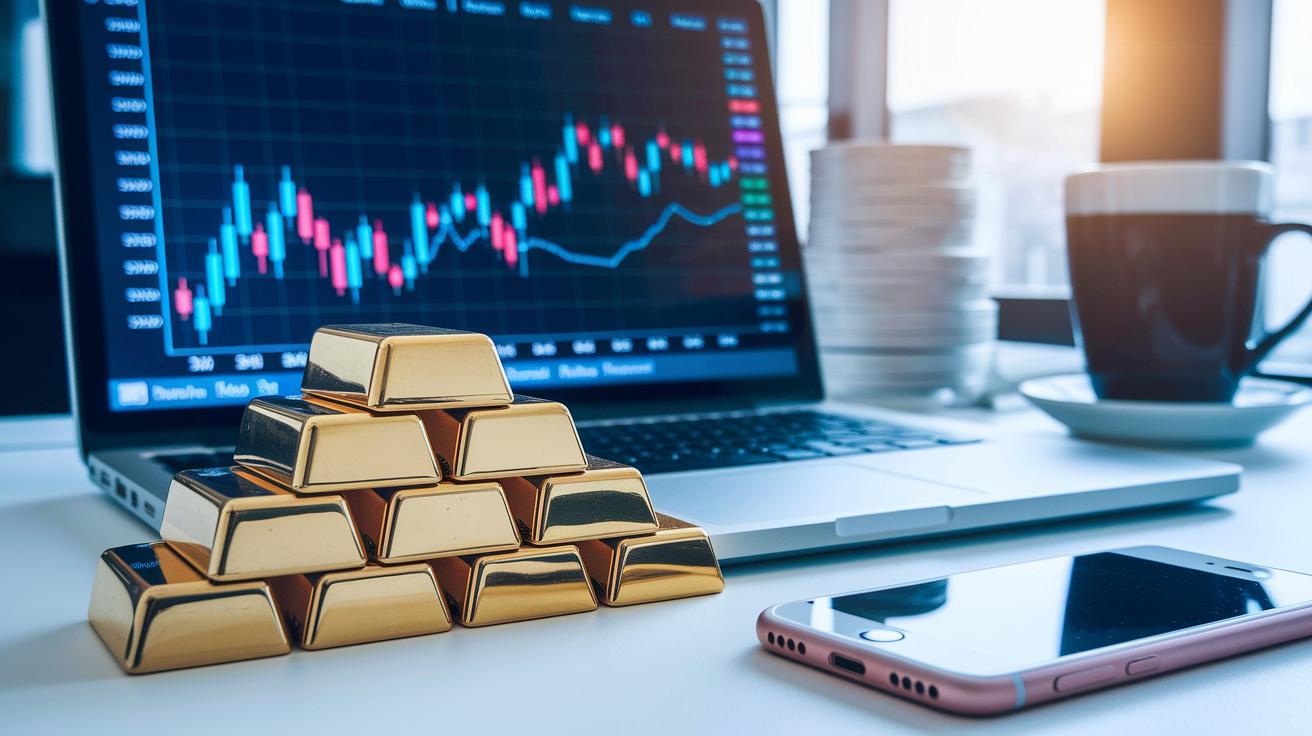
Investors often face a choice: hold on to gold or sell it based on its cost and the expected return. It’s a bit like deciding whether to stick with a favorite recipe or try a new twist. For example, if your gold investment has grown but you paid a high price, you might want to wait for better market conditions. Experts stress the importance of preserving your purchasing power when you convert gold to cash, like protecting a well-loved recipe while keeping an eye on daily price changes.
Managing risk in gold investments is all about careful planning. Many experts suggest placing about 5-15% of your portfolio in gold to help balance risk. Think of it as having a reliable backup dish at a meal, something steady when the market shifts unexpectedly. Tools like investment analysis techniques can offer guidance on when to hold or sell, making the process smoother and more straightforward.
Watching market trends means paying close attention to even small shifts that might signal bigger changes. A tiny change today can hint at a larger swing tomorrow, so being proactive is key. Staying informed helps you adjust your strategy quickly, keeping your portfolio diverse and ready for unexpected turns.
Final Words
In the action, this post highlighted gold market trends by breaking down current price movements and key performance metrics. It connected modern data with a historical viewpoint while showing how economic forces steer gold prices. We also reviewed technical signals, real-time tracking, and long-term expert forecasts to help form smart risk management and investment strategies. Each piece adds insight into building a balanced portfolio. Staying updated on gold market trends can bring clarity and confidence as you shape your digital asset strategy.