
Ever wonder if simple lines can actually hint at market moves? Gann technical analysis, created over a hundred years ago, uses straight angles to show where prices might slow down or change direction.
It connects time and price in a way that makes market trends easier to see, turning old trading ideas into fresh insights. This method gives clear signals that help traders notice when market momentum shifts, serving as a handy guide for anyone planning a trade.
The mix of geometry and the natural rhythm of the market might just change how you look at trading.
Comprehensive Overview of Gann Technical Analysis

Gann technical analysis is a trading method first introduced in the early 1900s by W.D. Gann. It uses simple geometric angles to look at market moves. Instead of just drawing horizontal lines, this approach draws sloping lines from key price points to show where the market might slow down or bounce back. In short, it layers time together with price to give traders a fresh way to understand market behavior.
The heart of this method lies in balancing price and time. A well-known tool in this approach is the 45-degree or 1×1 line, which suggests that the pace of price changes matches the passage of time. This neat technique helps traders see when the market is running smoothly or getting ready to change direction. By blending price actions with timing cues, traders get a clearer view of market rhythms.
Even now, these ideas help traders figure out market structure and spot potential turning points. Modern strategies lean on Gann technical analysis because it links what happened in the past with what might happen next. These clear, geometry-based signals continue to offer honest and practical insights for anyone planning trades in today’s fast-paced markets.
Historical Foundations of Gann's Methodology
W.D. Gann was one of the early trailblazers in trading, and his work still sparks interest today. He mixed ideas about price, time, and even geometry into a single way of looking at the market. He came up with 17 key rules that pointed out market clues like weekly highs and lows, and ratios such as 5:3 and 9:5 (these ratios are like simple fractions that can show market corrections). For example, if the highest price of a full week happens on a specific day, it gives a solid hint that prices might soon start climbing. His step-by-step method set a clear path for spotting important price points where markets might turn.
Gann also invented tools that used shapes and angles to read market action. He developed things like the Square of Nine and the Gann Fan, which placed price data onto geometric frameworks. When you see a 45-degree line on a chart, it's a friendly reminder that price and time are working in balance. This idea has influenced many who came after him, and today it remains a trusted tool for understanding how markets move. It’s pretty amazing to see how these ideas still help traders look at market trends with fresh eyes.
Core Principles: Price-Time Integration and Geometric Theories in Gann Analysis
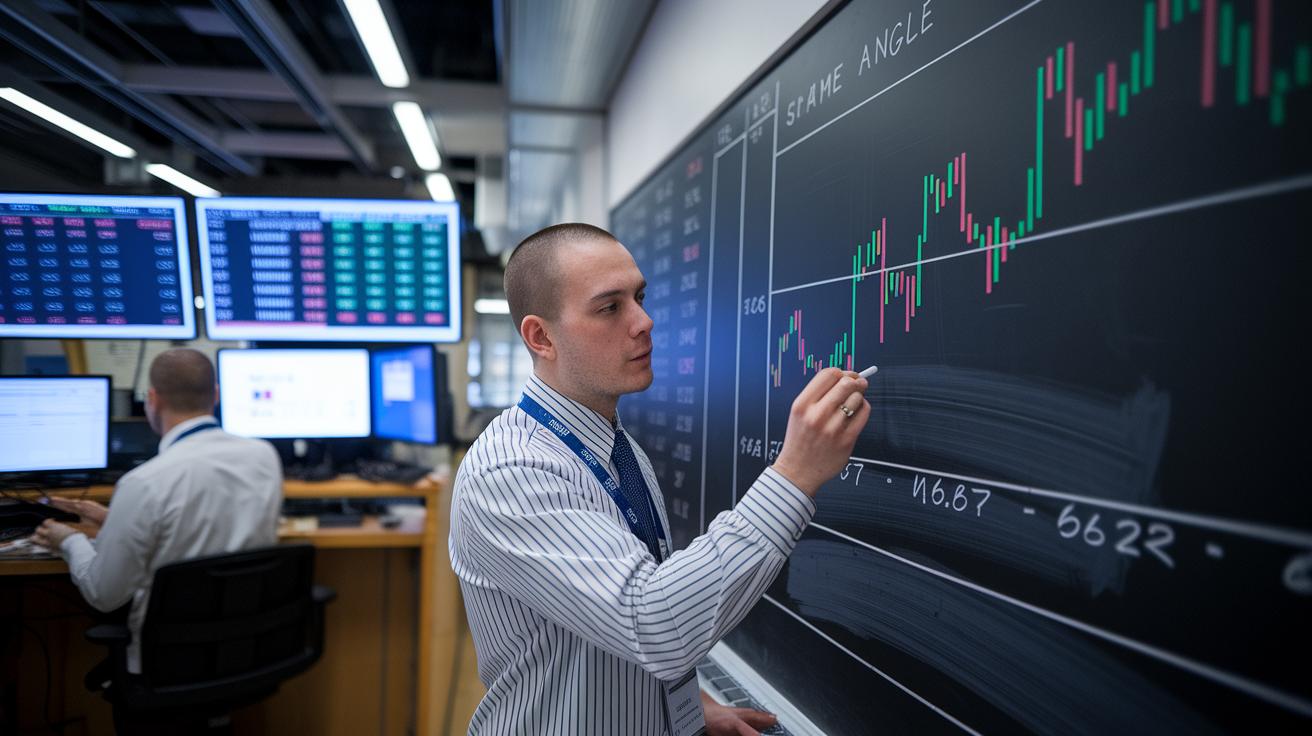
Gann’s work centers on the idea that price and time go hand in hand. He transformed price differences into time-based angles so that a simple change in numbers can guide you like an arrow on a map. Imagine a trader converting a price move into a clear, visual signal that marks when to watch the market.
Geometric value theory takes this idea further by focusing on how things relate. It turns raw price data into angles that light up hidden patterns in the market, much like plotting points on a simple graph where every angle tells a part of the story. This hands-on approach adds extra depth to our understanding of the relationship between price and time.
- 1×1 (45°) price/time balance
- Ratio-based corrections (5:3, 9:5)
- Proportional level determination
These smart techniques work hand in hand with pivot discovery strategies. By shifting price movements into time-based signals, they build on classic methods to reveal key market changes.
Gann Angles, Fans, and Square Nine: Geometry Tools Explained

The Gann Fan kicks off by drawing a single line between two major high or low points. From that line, nine diagonal lines emerge, one of which is the well-known 45-degree (or 1×1) line. This tool acts like a friendly visual guide, balancing the smooth flow of price changes with the steady march of time. Many traders see that 45-degree line as a clear marker that the market is moving in balance.
The Square of Nine works in a different way. It arranges numbers into a spiral grid that looks a bit like a growing maze. This spiral helps traders spot angles that match key support and resistance areas. In other words, it turns plain numbers into a visual map that highlights where the market might turn or pause.
Other methods build on these ideas by using ratios like 2×1 or 1×2 to sketch out possible market channels. These extra techniques add more ways to understand market structure, turning abstract numbers into signals you can act on. For example, a trader might use a 2×1 angle to check if a current trend is strong or if a change is likely coming soon.
| Tool | Description | Primary Use |
|---|---|---|
| Gann Fan | Nine angled lines from one trendline | Shows trend channels |
| Square of Nine | Spiral grid of price numbers | Maps support and resistance |
| 45° Angle (1×1) | Line with equal price and time pace | Highlights key trends |
Cyclical Forecasting and Temporal Patterns in Gann Analysis
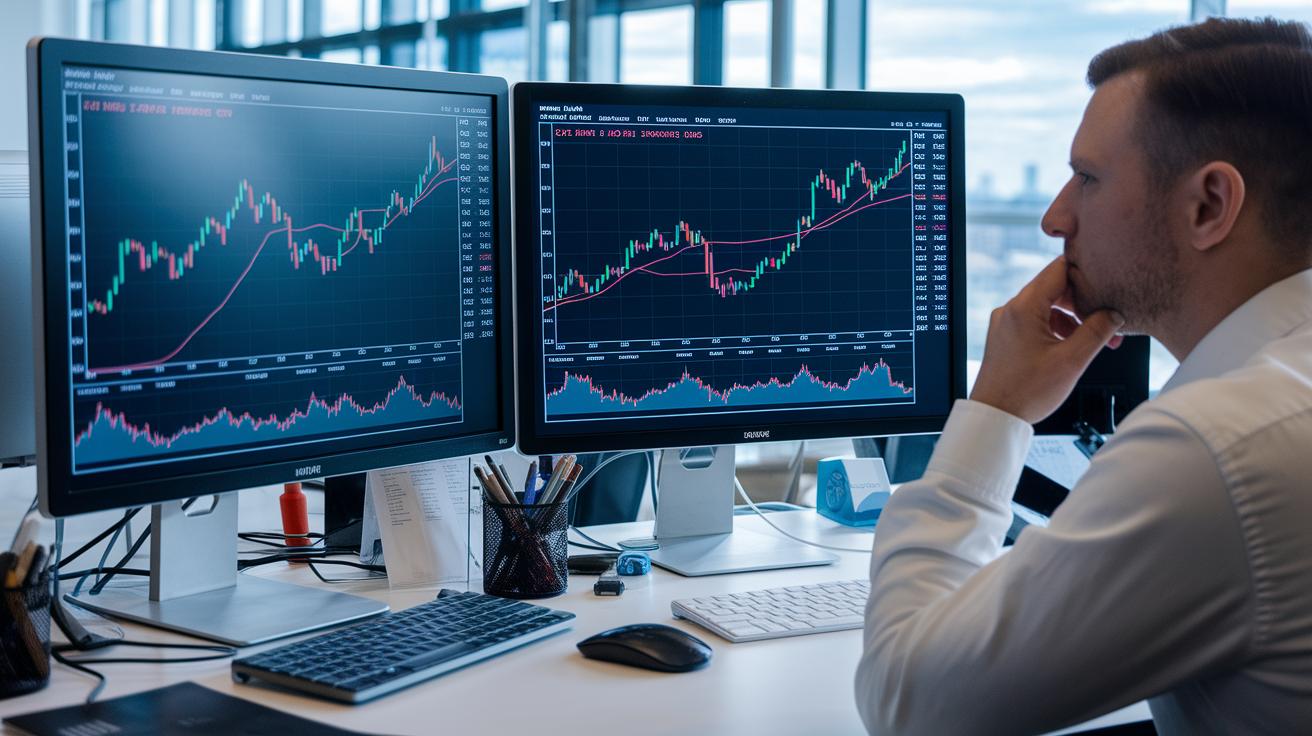
Gann noticed that markets tend to follow a set rhythm based on specific time cycles. He found that price movements often repeat in loops of 30, 60, and 90 days. It’s a bit like watching the steady beat of nature, where each time span has previously marked similar shifts in market behavior. By keeping an eye on these time frames, traders get a better sense of when changes might happen.
When you map out these cycles, you sharpen your view of market momentum. Gann’s method balances longer-term trends with shorter, quick adjustments, helping you see a complete picture. It’s like comparing the long, calm river flows with the small ripples along the edge. This balance can show if the market is wrapping up a trend or getting ready for fresh movement.
Noticing when these cycles complete can hint at likely turning points in the market. It’s as if the market is giving a friendly nod, letting you know it might be time for a switch in strategy.
Gann technical analysis: Powerful Trading Insights
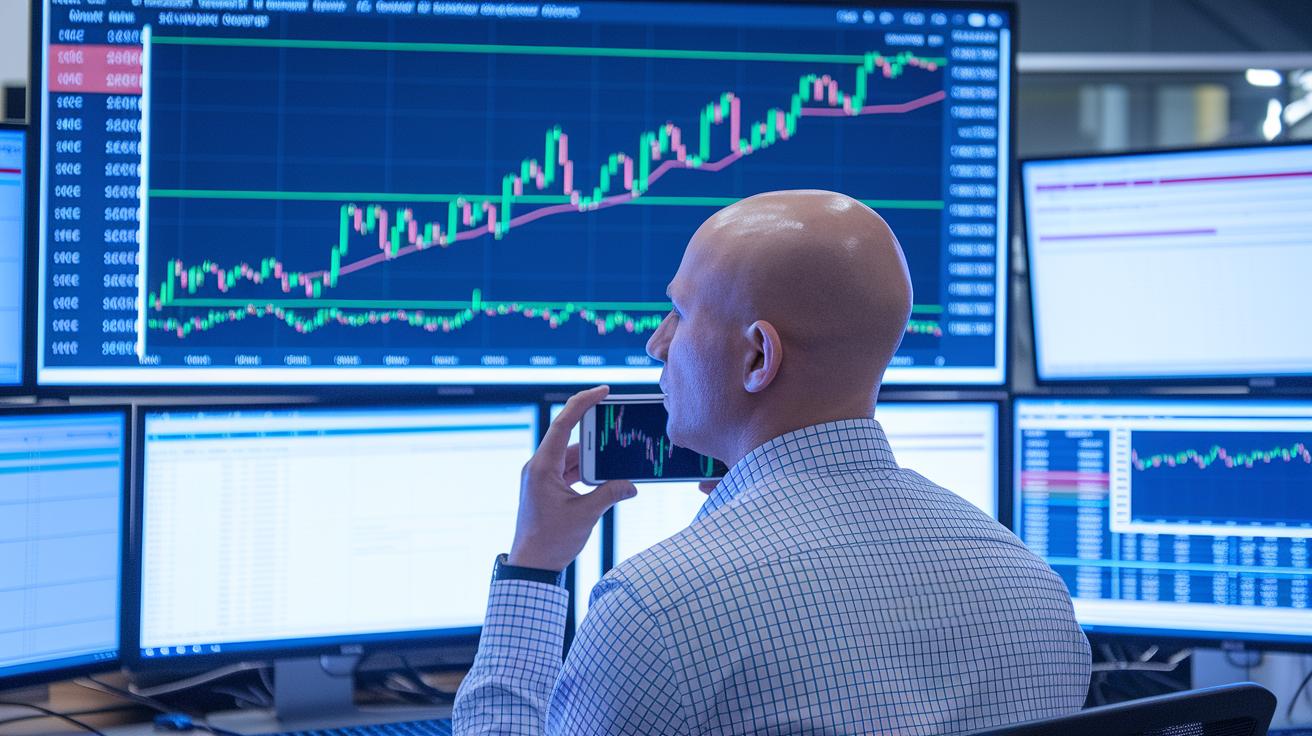
Traders saw real wins with Gann technical analysis on stocks like Nvidia (NVDA) during 2023-2024. One example is the use of the 1×1 line which helped match price jumps with specific time intervals. When NVDA’s price hit this balanced line, it often hinted at a good time to buy or sell. These cases show how mixing simple geometric techniques with market info can give clear, practical tips during live trading.
When deciding when to enter or exit a trade, investors count on the clear signals from Gann angles. The 1×1 line acts as a straightforward tip-off for a trend change. Once the price meets this line, it often signals that it’s time to act. For example, a trader might watch the price to see if it keeps following the 1×1 path before making a move.
To make this strategy even stronger, many traders pair it with wave dynamics and oscillators. Using tools like Gann fans along with these angles lets them feel the rhythm of the market. Techniques like the 5:3 and 9:5 corrections help spot small drops or jumps during longer trends. These extra checks back up the simple angle signals, turning abstract price patterns into clear, actionable advice.
It’s also important to watch risk and momentum when trading. Momentum indicators help confirm that the angle signals come from a solid market move. At the same time, practical risk measures like setting stop-loss orders protect against sudden reversals. Blending smart risk controls with clear entry and exit points lets traders handle surprises and keep steady in fast-changing markets.
Gann Analysis: Best Practices, Pitfalls, and Integration with Modern Tools

Traders who use Gann technical analysis sometimes run into problems like drawing angles in the wrong spot, picking unsuitable chart scales, or cluttering their charts with too many lines. These kinds of mistakes can make it hard to see clear patterns and spot important turning points in the market. When angles aren’t calibrated just right, it can hide the natural rhythm of the market and even confuse signals that tell you when a reversal might be coming. Even a tiny setup error can alter the way you view market trends, so it’s a good idea to double-check everything.
Best practices suggest that traders verify their signals with extra tools like moving averages, Fibonacci retracements (which help measure support and resistance) and oscillators (simple tools that track market momentum). Many smart traders also use automated software tools, like the ones at https://gotocryptos.com?p=641, to set angles precisely and test strategies using past market data. These modern charting platforms take much of the guesswork out of assessing market structure and understanding financial cycles by reducing subjectivity. Combining ideas from momentum indicators with trading wave dynamics can sharpen those pivot detection tactics. When you use these tools together, you get a fuller picture of market behavior and are more likely to catch early signs of market reversals. This approach helps traders use Gann analysis with greater accuracy and consistency over time.
Final Words
In the action, we broke down the core elements of Gann technical analysis, from its historical roots to today’s practical trading strategies. We examined price and time principles and geometric methods like the Gann Fan and Square Nine to highlight market trends. The discussion also touched on cyclical patterns and risk control to help guide balanced decisions in digital finance. Embrace these insights to refine your strategy, stay adaptable, and make confident moves as you build a robust digital asset portfolio.
FAQ
Where can I find useful PDFs on Gann trading strategies?
The Gann trading strategy PDF bundles often include details on time cycles and theory. They show how price meets time through geometric angles and ratios, providing a clear guide for applying these concepts.
What is a Gann calculator?
A Gann calculator converts price differences and time data into geometric angles. This tool assists traders in mapping potential support and resistance levels by quickly generating price-time measurements.
How accurate is the Gann theory of technical analysis and forecasting?
The Gann theory combines price-time relationships and precise angles to predict trends. Its accuracy varies with market conditions, and many traders use it as a supportive tool alongside other technical indicators.
What is the Gann theory of technical analysis?
The Gann theory uses integrated price and time analysis, geometric angles, and ratio-based corrections to map out market trends. This method helps in identifying support, resistance, and turning points on charts.
Is Gann trading still relevant today?
Gann trading methods continue to influence modern analysis by offering a unique price-time perspective. Many traders adapt his geometric techniques with digital tools to enhance their technical insights.
How do Gann indicators in TradingView and Gann chart trading aid analysis?
Gann indicators in TradingView and Gann charts visually define angles and trends. They simplify spotting market pivots and support levels, making it easier to apply Gann’s methods on live, digital charts.
Where can I find William Delbert Gann books?
William Delbert Gann books are accessible through libraries, online retailers, and digital archives. These texts provide in-depth explanations of his unique approach to market analysis using price-time geometry.
How do Gann’s methods compare to those of traders like Richard Wyckoff, Jesse Livermore, George Soros, Paul Tudor Jones, and Steve Cohen?
Gann’s methods are rooted in geometric patterns and time cycles, while figures like Wyckoff and Soros focus on market behavior and trend dynamics. Each trader’s approach offers unique insights that enhance overall market understanding.
