
Ever think that a simple math trick could help you make better trading decisions? Fibonacci retracement uses steady numbers, like 23.6% and 61.8%, to guess where prices might change direction.
This idea comes from a 15th-century math expert. Traders use it by marking key high and low points on a chart to see where the price might bounce back or drop.
In short, this method is a handy way to spot support and resistance levels. Ever noticed how a few simple numbers can point you toward your next move?
How Fibonacci retracement technical analysis identifies key support and resistance levels
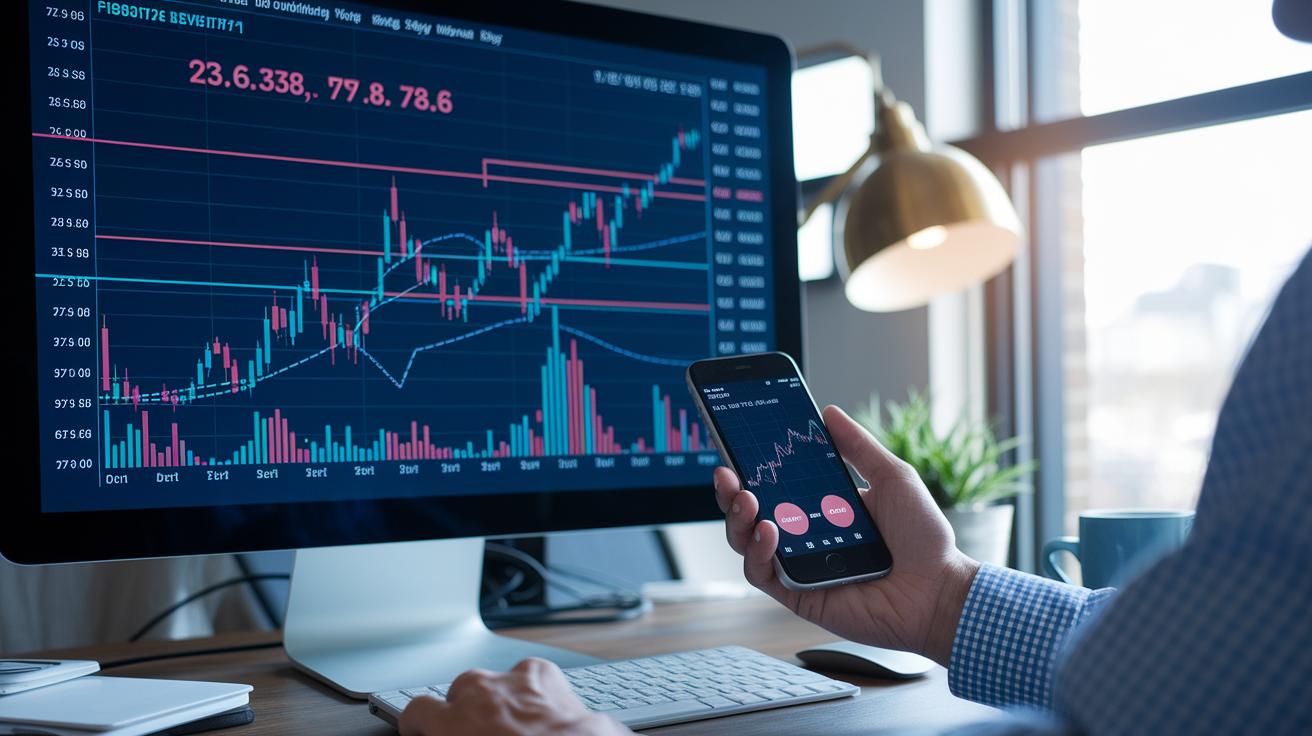
Fibonacci retracement is a tool that uses fixed percentages like 23.6%, 38.2%, 50%, 61.8%, and 78.6% to suggest where prices might bounce or turn around. It comes from the ideas of Leonardo Pisano, a smart math mind from the 15th century, and it works on charts that range from quick, minute-by-minute views to longer weekly overviews. Many traders plot these percentages from a recent high to a low to spot potential support and resistance points. For example, one experienced trader once mentioned that prices often seemed to hesitate right around the 61.8% level when things got volatile.
Each Fibonacci level hints at a different part of the market's story. The 23.6% level typically signals a small pullback. Then, the 38.2% level might show a stronger pause before the price resumes its trend. Although 50% isn’t an official Fibonacci number, it still appears often enough to matter. The 61.8% level, in particular, usually acts as a firm support or resistance point, while the 78.6% level – seen less often – can mark an extreme pullback before the market might reverse. For more on these patterns, check out some technical analysis chart patterns here: technical analysis chart patterns.
Traders start by picking out the most recent high and low on the chart. Then, they measure the entire price range and multiply it by each Fibonacci percentage to find key levels. They draw horizontal lines at these points, which makes it easier to see where prices might find support or run into resistance, helping guide more informed trading moves.
Calculating Fibonacci retracements: step-by-step method
Start by spotting the highest and lowest points on your price chart, the swing high and swing low. This step is your launchpad for measuring market moves.
Then, work out the total price range by subtracting the swing low from the swing high. This range tells you how wide the market swing has been. Multiply this value by the Fibonacci percentages: 23.6%, 38.2%, 50%, 61.8%, and 78.6%. Think of these as tools that help you find where prices might bounce back.
If the market is falling, subtract each resulting number from the swing high. If it’s rising, add each to the swing low. These numbers become potential spots where the price could find support or hit resistance.
Now, draw horizontal lines at these key levels on your chart. These lines serve as handy markers that can help guide your next move, much like landmarks on a familiar route.
Finding these swing points is a bit like setting the stage for a performance, the whole picture helps you see where the action might happen next. For example, if a stock moves from $80 to $100, that $20 range, when multiplied by 61.8%, gives you about $12.36. In a lively market, this level might be tested over and over, so it’s a good idea to keep a close eye on it.
Charting Fibonacci retracement technical analysis across multiple time frames
Traders often use Fibonacci retracement, a tool based on the golden ratio that helps predict where prices might bounce, to study price pullbacks. For example, on a 4-hour chart of Ethereum from May 23, 2025, the dynamic plotting of levels can catch quick shifts and brief swing corrections. Sometimes, though, the busy nature of these short time frames can make it hard to clearly see support or resistance.
Daily charts tell a slightly different story. Take Bitcoin’s chart from December 2024, where the retracement centers around the 50% level. Here, the signals tend to be smoother and more dependable. When you step back to look at weekly charts, the mapping of broader zones gives traders a clearer picture for confirming long-term trends.
Shorter time frames deliver many signals that work well for quick trades, but they can get cluttered because of temporary price moves. In contrast, longer time frames show stronger swing corrections and guide investors who prefer a steadier approach. It’s smart to match your chart view to your trading style and review historical key levels for trend analysis (https://tradewiselly.com?p=3138). This way, the Fibonacci retracement tool becomes a solid part of your overall trading plan.
Fibonacci retracement technical analysis Sparks Winning Trades
When you mix Fibonacci retracement with other market signals, it sharpens your trade ideas by linking price patterns with the market’s energy. It means you blend signals from oscillators (tools that measure trends) and trend lines to catch the small shifts in market energy and find entry points that match your risk level. This method lets traders confirm key turning points and adjust their tactics whenever several signals meet at important Fibonacci levels.
| Indicator | Purpose | Confirmation Signal |
|---|---|---|
| MACD | Shows momentum and trend changes | Bullish or bearish crossovers near 61.8% Fibonacci level |
| RSI | Indicates overbought or oversold market conditions | Readings around the 38.2% Fibonacci level |
| Trend Lines | Helps highlight how prices follow market flow | When they meet with Fibonacci retracement lines |
| Moving Averages | Smooths out price trends for clearer insight | When they act as support or resistance at Fibonacci levels |
By combining these signals with Fibonacci retracement, each indicator backs up the trade setup and builds your confidence. For example, if you see a bullish crossover on the MACD at the 61.8% level and moving averages confirm support, it strengthens the case for a solid entry point. Next, check out these additional techniques in the technical analysis indicators for more tips on tuning your approach to spotting momentum shifts.
Fibonacci retracement technical analysis Sparks Winning Trades
We start with a clear plan that mixes finding the best entry price with keeping risks in check. First, you spot the high and low swings on your chart. Then, you add Fibonacci retracement levels to guide your trade. For example, you might choose to enter at the 38.2% level and set your stop-loss just below the 50% mark. Think of a stop-loss like a safety guardrail on a steep road, it helps keep you steady when the market suddenly shifts.
Next, we look at the finer details that go beyond the usual setups. You might have seen examples on a 4-hour Ethereum chart or a daily Bitcoin chart. In these cases, small movements really matter. Watch each Fibonacci level for slight corrections. Sometimes, if you notice a modest shift near the 50% level, you may adjust your tactics. Other times, you could decide to take profits when the price reaches levels like 61.8% or 78.6% as the market evolves.
This approach blends reading price waves, spotting swings, and handling correction phases into one smooth trade plan. You keep an eye on real-time market signals and use each Fibonacci level as a checkpoint for both risk management and profit taking. For instance, aiming for a higher extension might signal a strong rally, while a deeper retracement could mean it's time to tighten your position.
Common pitfalls and best practices in Fibonacci retracement technical analysis
One common error is choosing the wrong swing points, which can lead you to mark levels that miss key price moves. Some traders lean too much on the 50% level, though it isn’t part of the true Fibonacci set, and end up ignoring other important ratios. And when the bigger market picture gets ignored, things can get tricky since surrounding trends and outside factors really matter. Plus, if you don’t adjust when the market is wild, your signals might not hold up and could even expose you to extra risk.
A smarter approach is to back up your points with matching chart patterns. It helps to check if there are volume bumps (spikes in trading activity) that can boost the signal’s strength. This basic check makes it easier to see if a reversal may be coming. Cutting your position when prices break nearby retracement zones can really help manage losses when the market shifts fast. And by keeping a flexible plan with regular reviews of your reversal ideas, you make sure your moves stay steady and confident.
Final Words
In the action, the article explored how Fibonacci retracement technical analysis helps spot key support and resistance points. It broke down the process of plotting the ratios and showed practical examples across different charts. Each section built on the last to illustrate clear trade setups and risk checks. This method brings clarity and confidence when planning digital asset moves. The insights shared empower a smart, diversified approach that makes smart investing feel more secure and within reach.
FAQ
What is a Fibonacci retracement in technical analysis?
The Fibonacci retracement in technical analysis defines key ratios (23.6%, 38.2%, 50%, 61.8%, 78.6%) drawn from a price swing to spotlight potential support or resistance areas.
Do Fibonacci retracements actually work in trading?
Fibonacci retracements work by signaling likely reversal points when a market pulls back. Their success increases as traders combine them with other technical tools to confirm trends.
What is the golden ratio in Fibonacci retracement?
The Fibonacci retracement golden ratio, typically 61.8%, identifies a crucial level where prices often reverse, drawing from a mathematical balance found in nature and extended to market movements.
How can traders use Fibonacci retracement for intraday trading?
The Fibonacci retracement strategy for intraday trading involves plotting retracement levels on shorter time frames to catch fast price pullbacks, offering precise signals for timely entries and exits.
What are the best settings and time frames for Fibonacci retracement?
The best Fibonacci retracement settings usually rely on standard levels, while the ideal time frame depends on your plan—shorter frames deliver frequent signals, and longer ones yield stronger support zones.
How does a Fibonacci retracement calculator work?
A Fibonacci retracement calculator works by automatically computing key levels from a chosen swing high and low, simplifying the plotting process and reducing potential manual errors.
What are Fibonacci extension levels in analysis?
The Fibonacci extension levels extend beyond retracement zones to predict target zones for price moves beyond the initial swing, guiding traders on potential exit decisions after a trend resumes.
What is the success rate of Fibonacci retracement?
The Fibonacci retracement success rate depends on market conditions and careful confirmation with other signals. It provides valuable cues for reversals yet should be part of a broader analytical strategy.
How do I correctly use Fibonacci retracement in practice?
Using Fibonacci retracement correctly involves pinpointing accurate swing highs and lows, plotting the standard ratios, and confirming these levels with extra technical indicators for better trade precision.