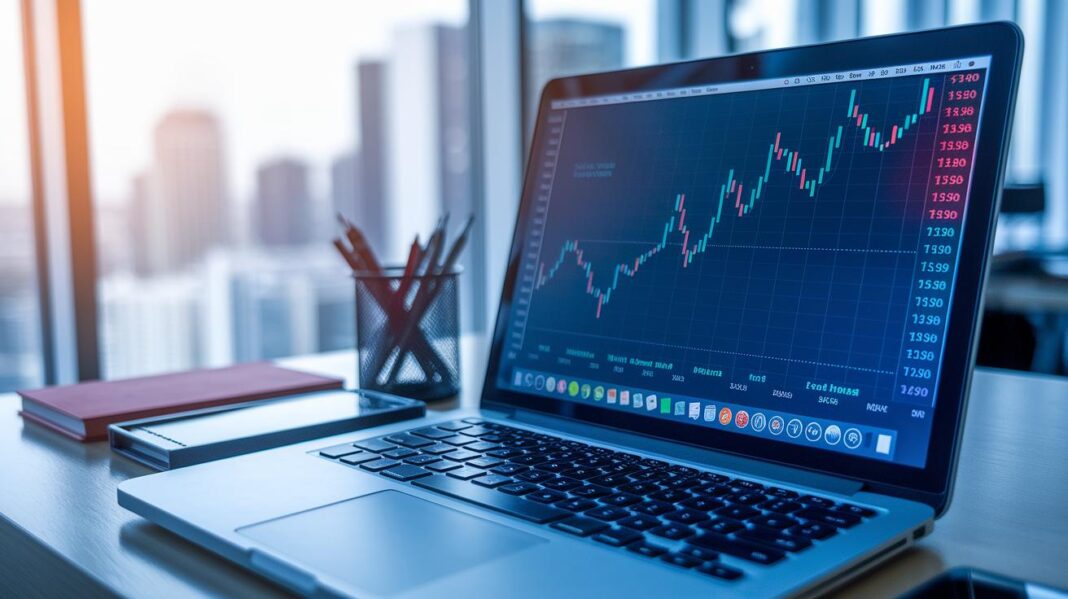
Have you ever noticed how market numbers almost have a heartbeat? Economic signals like GDP (the total value of goods and services in a country) and job data (a snapshot of employment trends) act like a car’s speedometer, showing you just how fast things are moving. When these numbers climb, it’s a bit like seeing a small shop light up with new sales, sparking a wave of confidence.
In this chat, we’ll break down how these key data points can lift market moods and steer smart choices. In short, a bright outlook often starts with solid numbers and a steady pace.
How Economic Indicators Influence Market Sentiment

Strong GDP growth with low taxes and a drive for new ideas helps build a positive vibe that attracts money from abroad and supports long-term growth. Think of these economic signals as parts of a clock working together to keep investor confidence on track with market trends. For instance, when a country posts solid GDP numbers, it sends a clear signal that its economy might be gearing up, similar to a small shop that suddenly sees a boost in sales, sparking local excitement.
Analysts look at tools like the VIX, which measures market fear (a quick note: it shows how nervous investors might be), the NYSE High/Low Indicator that tracks the highest and lowest prices, and the 200-day moving average, which smooths out the ups and downs, to gauge whether investors feel confident or worried. These simple measures help decision makers quickly understand if the market mood is leaning towards optimism or concern.
Keeping a close eye on these key numbers lets decision makers tweak their strategies almost in real time. It’s a bit like watching your car’s speedometer on a long drive, you adjust how you drive based on what you see on the gauge. In short, this regular monitoring guides our steps in the ever-changing market mood.
Global Economic Indicators Driving Market Sentiment

Strong GDP numbers give us a clear sign that a country’s economy is on the right track, much like a cozy café becoming the new local hotspot after a little makeover. When GDP steadily grows, investors see it as a promise of long-term prosperity.
Next, inflation plays its part too. When prices rise gently (so your wallet isn’t hit too hard), it reassures everyone that buying power isn’t vanishing overnight. This calm allows investors to feel secure in the market.
Job data is another big clue. Rising employment shows that companies are hiring more, boosting consumer confidence and spending. It’s like watching more lights flick on in a busy downtown, clear signs that business is good.
Then there’s the role of central banks. When they adjust interest rates gradually (interest rates are the cost of borrowing money), it gives investors a smoother path to plan their next moves. This, combined with sound government policies, helps keep the market steady.
Finally, smart fiscal investments add an extra layer of comfort. Together, steady GDP, controlled inflation, and growing job numbers create a market environment that feels supportive for making smart, confident investment decisions.
Key Market Sentiment Indicators and Volatility Measures

Technical measures like the VIX (often called the fear index, which tells us how scared or calm investors are) give you a quick peek at the mood in the market. When the VIX jumps, it’s like dark clouds rolling in on a sunny day, traders are getting nervous, and that can shake up stocks and even bonds.
Another set of tools you can trust includes the NYSE High/Low Indicator (it shows a stock’s top and bottom prices) and the 200-day moving average (a simple trend line that smooths out daily price bumps). The 200-day moving average is like a compass for many traders. If prices are staying above it, that usually means investors are feeling positive, even if the market seems a bit choppy.
When you combine these with broader market indicators, you can spot the moments when confidence soars or turns into panic. For a closer look at more advanced market trend analysis, check out https://tradewiselly.com?p=2213. This mix of signals makes it easier to decide when to change up your strategy as market moods shift.
Media Influence and Global Dynamics in Market Sentiment
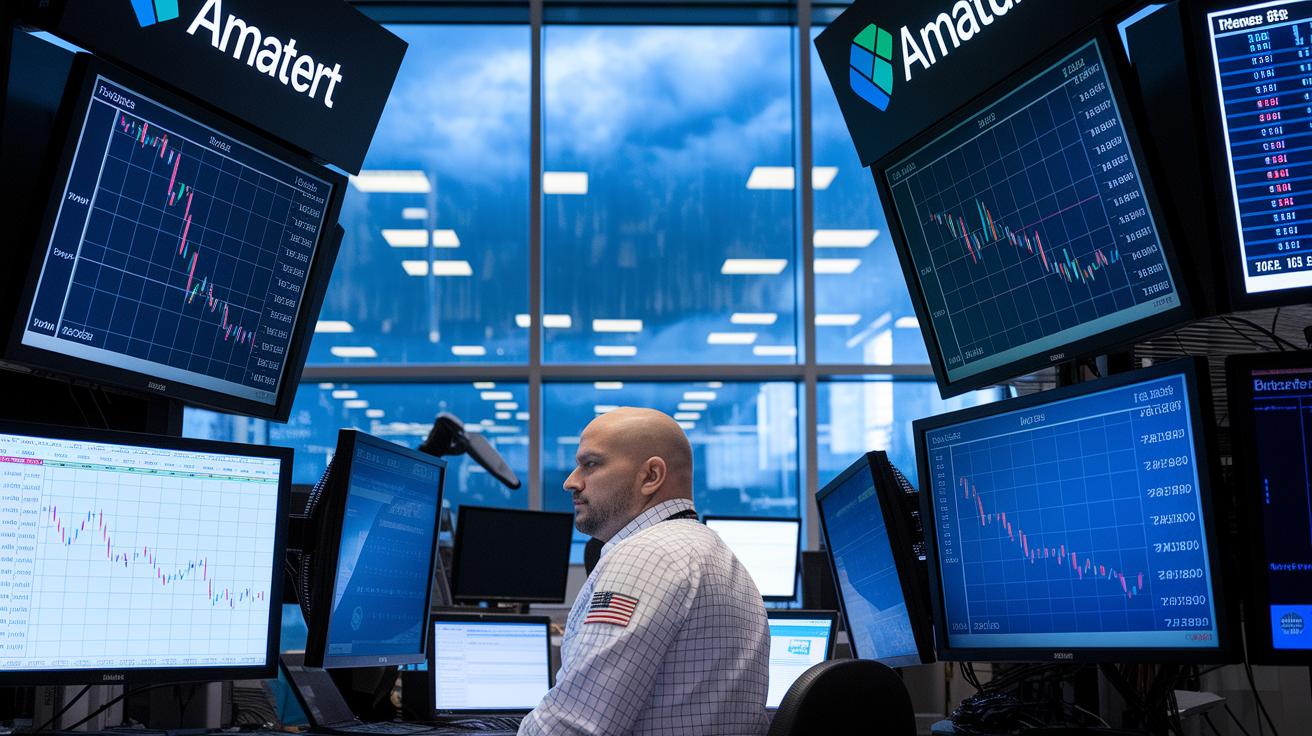
Media coverage really shifts market moods. When upbeat news about a strong economy hits, it can hype up buying like a headline that reads "Market Shines as Consumer Confidence Soars," and investors jump in. But when the news turns sour, it can cause panic selling and wild price swings, kind of like an unexpected storm on a sunny day.
News outlets do more than just crunch numbers. They add stories about government rules, corruption, or how easy it is to do business in a region. For instance, Switzerland, with its small population and strong economy, usually enjoys steady confidence in its markets, even if other places face challenges. And when global supply chain issues slow production and push costs higher, investors tend to take a more cautious approach.
Political risks and policy uncertainties add another layer to the mix. When reports highlight shaky policies or rising political risks, even solid economic data might not be enough to keep investors confident. Ever notice how quickly moods can change?
economic indicators and market sentiment: Bright Outlook

When you look at manufacturing activity, you get clear hints about how business cycles are shifting. Think of manufacturing PMIs (purchasing managers index, which tells us about new orders and production work) and industrial output indexes (a measure of total production) as early signs that affect market moods. For example, when these numbers steadily rise, it's like seeing a factory running smoothly, which brings a sense of optimism along the supply chain.
The services sector tells a broader story about the economy. When more spending shows up in services, it means that people and businesses are feeling confident, kind of like a neighborhood where a local café is packed with new customers every day.
Retail sales and housing market trends also add important clues. Picture retail sales as a store’s daily earnings; a busy cash register hints at rising consumer confidence. At the same time, new housing projects are like fresh paint on a city skyline, showing that people are excited about investing in their future homes.
Sometimes emerging markets surprise us. In technology and commodity sectors, emerging countries can grow faster than established ones when innovation speeds up. For instance, in one case an emerging market's tech sector jumped by 15 percent in just a few months, sparking excitement among investors who had never anticipated such a swift turnaround.
All these varying signals come together to create a vivid picture of market sentiment that shifts with each sector's performance.
Investor Strategies Using Economic Indicators and Sentiment Data

Companies and investors mix big-picture economic data with the market’s mood to design smart strategies. For example, imagine a tech company planning to grow in Southeast Asia; they might compare steady economic conditions with local feelings. In a place like Vietnam, where low labor costs meet a burst of creativity, these clues help them figure out risks and spot opportunities.
Live mood trackers and historical data give you a clear sense of investor confidence. Think about it like tending a garden: you check each plant and adjust your care based on how it's doing. When numbers like GDP growth and job stats join forces with market sentiment, they reveal the full rhythm of the market. This clear view lets you shift investments quickly while still following your long-term plan.
Forecast models play a big role when decision-makers use these combined data streams to guess what might come next. For instance, if factories start facing fewer supply issues, you might see steadier stock values. Investors notice that when production hiccups smooth out, the overall market mood tends to lift, encouraging a smart, gradual change in portfolios.
Solid strategy guides can really boost your approach. For more ideas, check out "fundamental analysis tips for growth-oriented investors" (https://tradewiselly.com?p=2290) and "investment analysis techniques" (https://nftcellar.net?p=430) for detailed frameworks.
Here's a neat fact: a minor change in how consumers felt once sparked an unexpected 12% rise in quarterly profits. It goes to show that by carefully mixing economic facts with sentiment checks, you can find clear paths to profitable choices.
Sentiment Analysis Tools and Forecasting Market Trends
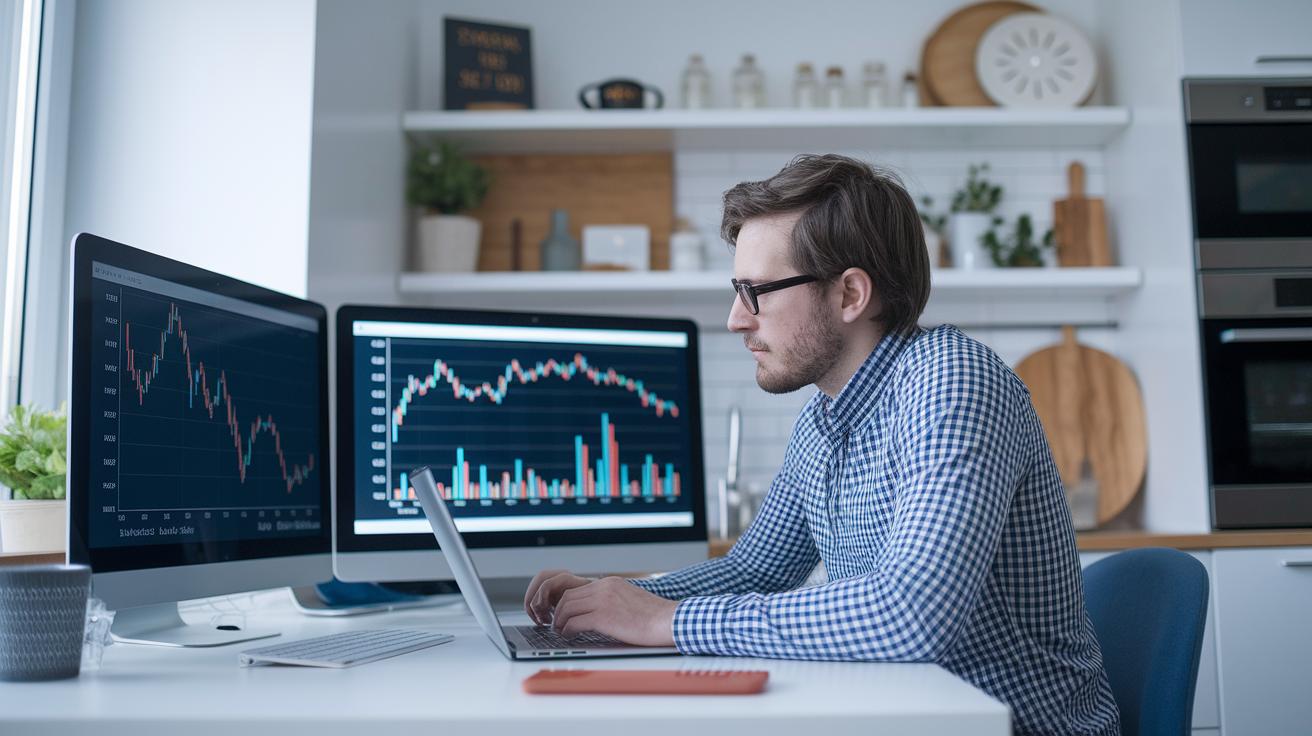
Tools like Semantic Visions gather current and past data on how people feel by tracking the top events each week in different industries. This lets you create your very own sentiment indexes, kind of like mixing ingredients to whip up a recipe that shows the market's mood. For example, you might catch a slight change in consumer feeling, much like the first cool breeze on a hot day, which can hint at changes long before you see them in the raw numbers.
Investors often pair these custom sentiment indexes with signals from forecast models. These models work like a weather report for the market. They check little hints from price shifts and tweak their outlook as new data rolls in, keeping your market view up-to-date and clear.
By folding these sentiment insights into risk-management strategies, you get a much clearer picture of potential recession warnings, growth opportunities, and stress tests on your portfolio. This method gives you a steady guide to help make smart and timely investment choices.
Final Words
In the action, this article broke down how macroeconomic data, like GDP growth and low inflation, shapes economic indicators and market sentiment.
We saw how tools capturing technical cues and investor emotions help refine investment strategies.
The discussion touched on how global trends and sector-specific shifts drive market moods.
All these elements work together to guide timely and secure investment decisions.
Keep the focus on these clear signals, and you'll be well-equipped to craft a balanced digital asset portfolio and face market shifts with confidence.
FAQ
What does market sentiment mean today?
The market sentiment today reflects investor optimism or caution by showing how confident traders feel about future price movements. It captures sentiments that drive buying or selling decisions.
How do economic indicators influence market sentiment and the stock market?
Economic indicators like GDP, employment, and inflation reveal the economy’s health. When these numbers are strong, they boost investor confidence and help steer the stock market’s direction.
What are some examples of economic indicators related to market sentiment?
Examples include robust GDP growth, low inflation, and rising employment numbers. These figures contribute to a positive market mood by signaling economic strength and attracting investment.
Which market sentiment indicators are widely used, including TradingView tools?
Widely used indicators include the VIX, NYSE High/Low Indicator, and the 200-day moving average. Platforms like TradingView provide tools to track these metrics, offering real-time insights into investor mood.
What is the Fear and Greed Index, and how does it reflect market sentiment?
The Fear and Greed Index measures emotional extremes by comparing key market metrics. High fear suggests caution among investors, while high greed may hint at overconfidence in the markets.
How can charts and visual tools help in understanding market sentiment?
Charts plot economic data and sentiment trends visually, making it easier to spot shifts in investor confidence. Such tools help investors quickly grasp market behavior and adjust their strategies.
