
Ever looked at a market chart and wondered if its numbers might be hiding a secret? Some traders use neat techniques to mix hidden trends from order flow (the record of every trade) and Level II data (a snapshot of bids and asks) with user-friendly charting tools.
They watch these clues like the steady beat of a heart, spotting key levels and shifts before most others do. In our article, we walk you through these clever methods in plain language so you can boost your trading game.
Core Framework of Advanced Technical Analysis Techniques
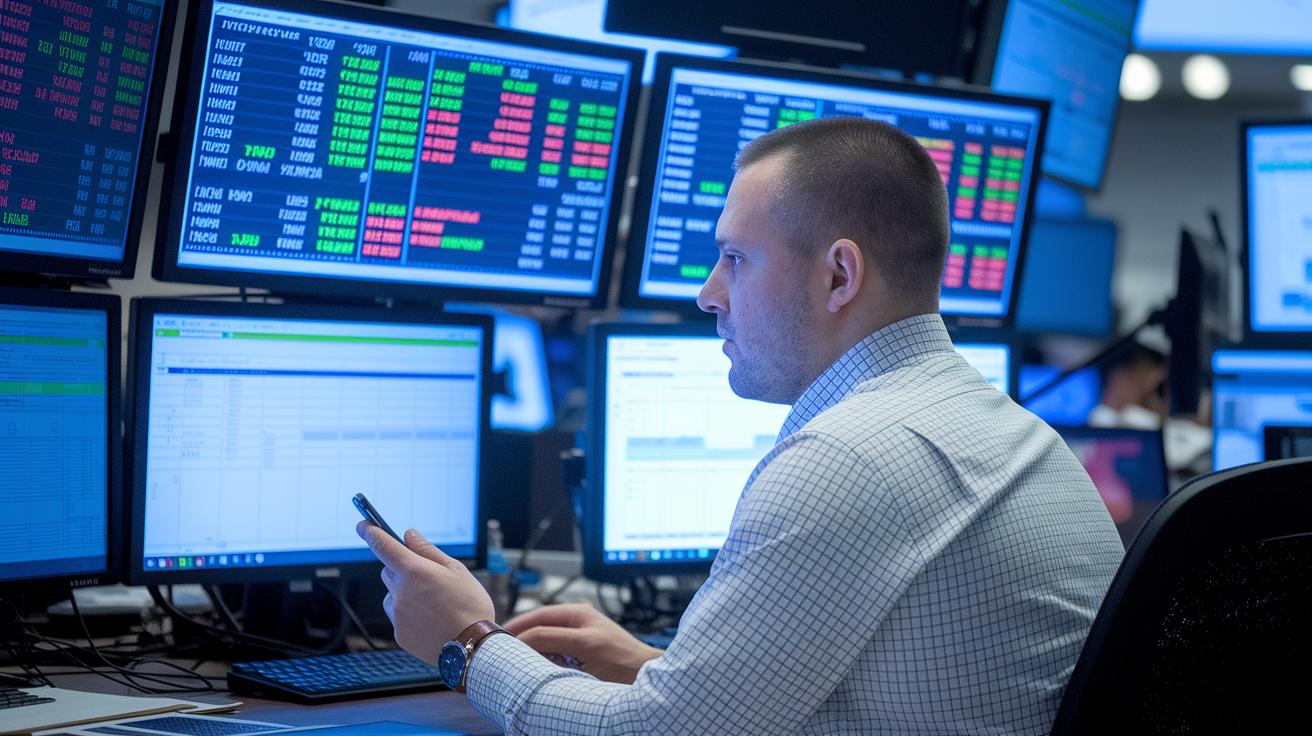
Investors can now go beyond basic market watching with smart tools that reveal hidden trends. These advanced methods mix details from order flow (the stream of incoming orders, like the market’s pulse) and Level II data (a closer look at multiple pricing layers) to spot key levels. For example, noticing a burst of swift selling might hint at emerging support. Little clues like wide bid-ask spreads or stealthy orders often help traders predict market reversals.
Modern charting platforms such as TradingView and StockCharts.com make a big difference. They bring together handy drawing tools, multiple technical indicators, and live time & sales data, turning raw figures into quick insights about breakouts or reversals. It’s almost like watching the market’s heartbeat in real time, helping you decide your next move with confidence.
Choosing a platform is all about what tools it offers, how fast it delivers data, and how easily you spot trends over different time frames. By pairing these advanced methods with each platform’s unique features, traders can fine-tune their strategies to meet today’s fast-paced market. For those looking to dive even deeper, exploring additional market trend analysis can really boost your edge.
| Platform | Key Indicators & Tools | Notable Features |
|---|---|---|
| TradingView | Order flow, Level II, drawing tools | User-friendly interface with multiple overlays |
| StockCharts.com | Fibonacci retracements, built-in indicators | Educational resources with clear chart patterns |
| Stock Rover | Screeners, financial databases | Screening and long-term data tracking |
| Trade Ideas | Algorithmic setups, pattern recognition | Real-time trade setup analysis |
| MetaStock | Over 350 stock tools, drawing instruments | Robust backtesting and system validation |
Price Action and Chart Pattern Techniques for Advanced Analysis

Candlestick analysis acts like a window into the market's feelings. Each candlestick tells a story about how traders are thinking, and spotting these shapes can show you when control might be switching from buyers to sellers.
- Evening star: This pattern hints that a strong rally might be losing steam and could turn bearish soon.
- Head and shoulders: Here, the bullish push starts to fade, suggesting a possible change in trend.
- Bullish engulfing: When this appears, it means buyers are stepping in strongly, possibly pushing prices up.
- Doji formation: This shape shows that traders are unsure, and a shift in market direction might be coming.
- Hammer pattern: Seen at the end of a downtrend, it hints that the market might reverse.
- Shooting star: This pattern suggests that when the market is overbought, a reversal could be on the horizon.
- Spinning top: It shows that buyers and sellers are evenly matched, often signaling a pause before the next move.
Next, drawing trendlines and marking support or resistance levels involve spotting swing highs and lows that act like natural checkpoints for price changes. When prices get close to these levels, their reactions can confirm your market setup.
Finally, oscillator signals, like MACD crossovers (a tool that helps show changes in market trends), provide extra confirmation for your ideas. You can even check them against detailed trend analysis from this source: trend analysis in technical analysis.
Geometric and Wave-Based Analysis Strategies in Technical Analysis

Geometric tools clear away the everyday market clutter so you can focus on the real trend. They look at shapes and proportions in price data, revealing the market's story without all the extra noise.
- Ratio 0.236: This level often hints at a small pullback, where quick corrections might wrap up.
- Ratio 0.382: This signals a moderate retracement, making it a potential spot to consider entering a trade.
- Ratio 0.500: This shows a balanced mid-correction and is commonly seen during stable trends.
- Ratio 0.618: This ratio is trusted as an indicator for reversals, often pointing to key support or resistance areas.
- Ratio 0.786: This level marks deeper retracement, often helping to confirm that a trend may continue.
To use Elliott wave cycles for trading, start by spotting five clear impulse waves that drive the trend. Then look for three corrective waves that smooth out price movement. Adding Gann-angle plotting, using specific angles to hint at turning points, brings in a fresh geometric perspective. And if you include harmonic patterns like those in Gartley or Bat formations, which mix in Fibonacci ratios for extra insight into possible reversals, you get a more complete picture.
Blending these strategies creates a meeting point of smart insights, guiding you through the pulse of market changes.
Statistical and Quantitative Modeling Methods for Enhanced Market Forecasting

Regression models let us see how factors like interest rates or job numbers can shift prices. They show how market numbers connect with larger economic trends, making it easy to spot patterns in price moves. Similarly, econometric market models use simple equations (basic math that explains change) to capture these links and reveal how changes in the economy affect pricing.
These methods break down tricky market actions into clear, measurable pieces and build a strong base for forecasting. They let traders see how big economic factors can tilt market trends, giving a concrete way to weigh risks and chances.
Statistical arbitrage uses z-scores (a simple tool that shows how far a number is from the average) to catch moments when prices drift too far from what’s normal, usually hinting that they might swing back. Cointegration screening finds two assets that tend to settle back to a usual price gap over time. By combining these methods, traders can spot small profits from routine market adjustments, relying on math-backed signals instead of just gut feelings.
Walk-forward backtesting checks these models by running them against historical data one step at a time. It tests the rules in real market conditions, making sure that the strategy holds up as the market evolves.
Algorithmic and Automated Trade Execution Techniques
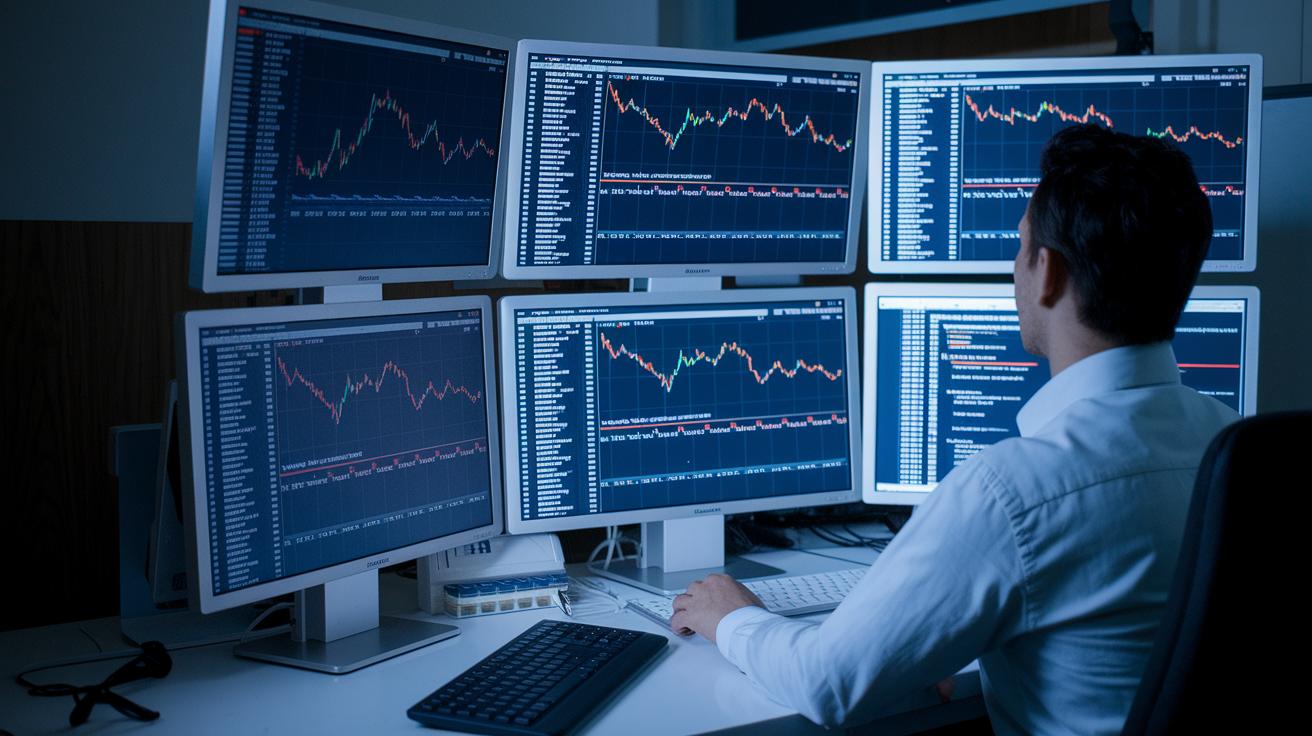
Algorithmic trading systems work by analyzing live market data with smart computer programs that check millions of trading setups each day. Platforms like Trade Ideas use this approach to help pinpoint opportunities quickly. These systems connect to broker platforms almost instantly using API integration (API: a tool that lets different software talk to each other), so your orders get in the market in a flash.
Every millisecond counts when market conditions are shifting fast. The time delay, or execution latency, is kept very short so traders can react quickly, an especially important feature in the digital asset world where even tiny delays can matter.
Next, walk-forward testing with tools such as MetaStock’s System Tester is a basic but crucial step. This method simulates how a trading strategy would have performed in the past by using historical data bit by bit. It helps build confidence that the strategy can hold up under different market conditions.
Simulation-based evaluation is another key piece of the puzzle. By running many in-depth simulations, traders can spot issues like maximum drawdown (the biggest drop from a high point) and assess the system’s overall strength. This hands-on testing helps fine-tune the algorithms, ensuring they perform reliably when put to work in real markets.
Machine Learning and AI Forecasting in Technical Analysis

These smart algorithms dig through huge amounts of market data to uncover hidden, twisty patterns that traditional methods might miss. By spotting tiny changes in price behavior, they help traders catch trends before they become obvious. In short, processing countless data points means that machine learning gives us a clearer, sharper view of how the market moves.
Recurrent Neural Networks (RNN) and Long Short-Term Memory (LSTM) models really step up the game. They remember past data sequences and use that memory to estimate what could come next, much like recalling past lessons to make better guesses for the future.
Deep learning models bring together several technical signals, like moving averages (a simple way to even out price changes), support and resistance levels (areas where prices may bounce), and oscillators (tools that show momentum), to create a full market picture. They continuously update with fresh market data through retraining, keeping forecasts accurate even as conditions shift. This constant fine-tuning means every new data point quickly finds its place in the overall outlook.
Adaptive learning systems jump in to classify the current market mood in real time. They offer practical insights that help traders adjust fast to changing conditions. Ever notice how quickly trends can shift? These systems make sure you're always in tune with the market’s pulse.
Risk Control and Execution Optimization in Advanced Technical Trading
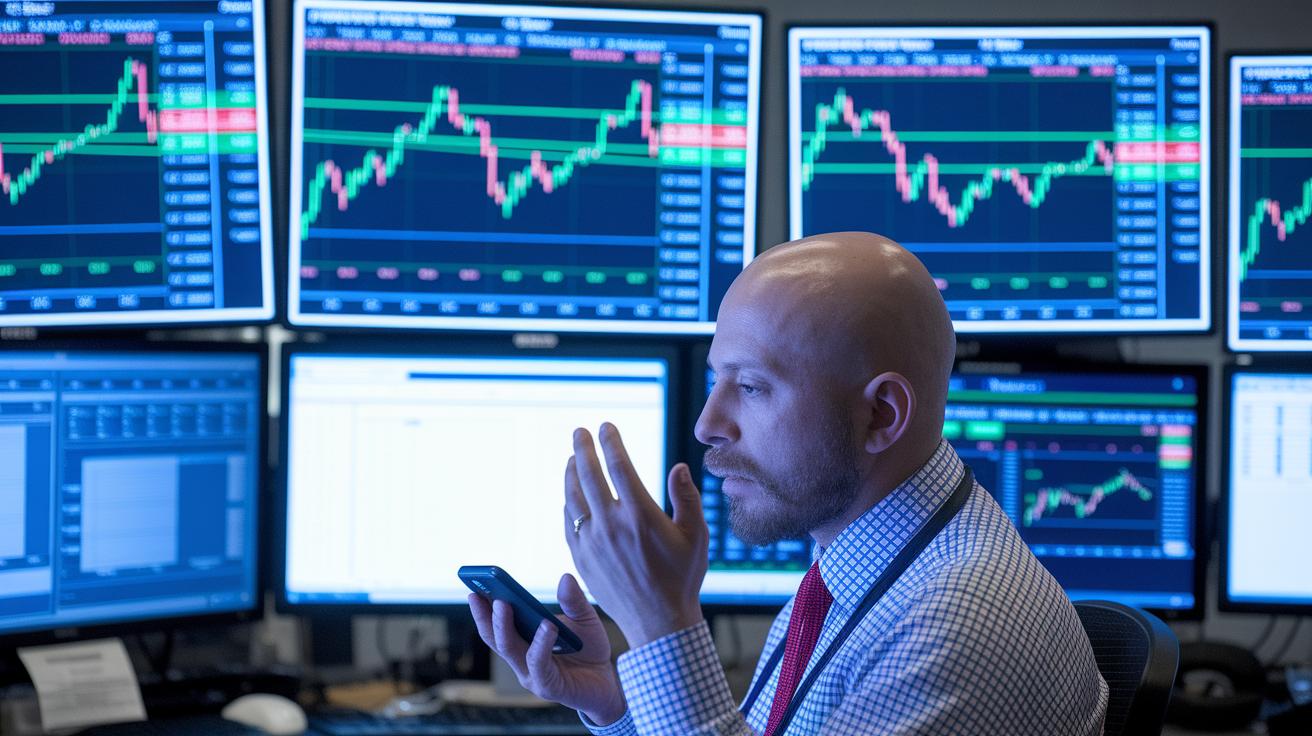
When you dive into shared trading ideas, emotions can run high. You know that gut feeling called FOMO (fear of missing out) can nudge you into snap decisions that might not match your planned strategy. In busy trading groups, fast and varied opinions can make you doubt your own choices, so you end up trading on gut feelings rather than clear analysis.
A smart tool here is the algorithmic stop-loss. This is a set plan that uses real-time data to decide when to exit a trade, protecting your investments. By setting stop-loss levels that move with market ups and downs, using what we call volatility-based bands, you can adjust your safety net as conditions shift. This means your exit moves quickly with the market pulse instead of staying stuck to fixed numbers. And because these stops trigger automatically when the market gets wild, you don’t have to stress over manual decisions during bumpy trading moments.
For deciding how big each trade should be and balancing potential gains with risks, methods like fixed-fraction sizing or the Kelly criterion can be really handy. These ideas help set clear limits, much like using tools such as VaR (value at risk, an estimate of potential loss) and max drawdown (the largest drop from a peak to a low). This structured approach makes sure each trade fits neatly with your overall financial goals. Every careful move builds up a trading style that can weather even unexpected shifts.
Final Words
In the action, the blog post broke down core frameworks where advanced technical analysis techniques blend modern charting platforms with price action insights. It touched on geometric methods, statistical models, and dynamic algorithmic systems to deliver a hands-on view of risk management and trade optimization.
This detailed guide invites you to analyze market trends further and embrace a confident future in digital finance. Keep exploring new strategies and building your robust digital asset portfolio with optimism and informed decision making.
FAQ
What is advanced technical analysis?
Advanced technical analysis refers to using sophisticated charts and statistical tools to spot trends, support levels, and reversals, helping traders make informed decisions based on market behavior.
What is the 50% rule in trading?
The 50% rule in trading suggests that prices often retrace about half of a significant move, indicating potential support or resistance levels that traders watch for potential entry or exit signals.
Which indicator is 100% accurate?
No trading indicator is 100% accurate; each tool has limitations. Combining several indicators and methods gives traders better insight and helps manage risk in ever-changing market conditions.
What are the techniques of technical analysis?
The techniques of technical analysis include chart pattern recognition, trendline drawing, candlestick analysis, statistical modeling, and automated strategies to help forecast market movements and manage trade risk.
Where can I find resources for advanced technical analysis?
Resources for advanced technical analysis include comprehensive books and PDFs that cover chart studies, indicator lists, and multi-timeframe evaluation. Many financial websites and publishers offer these guides for dedicated traders.
How does AI contribute to advanced trading chart analysis?
AI contributes to advanced chart analysis by processing huge data sets to spot non-linear patterns. It assists traders by providing automated signals and insights through advanced algorithms that help confirm market trends.
What technical indicators are most useful for day trading in the stock market?
For day trading, popular technical indicators include moving averages, MACD, RSI, Bollinger Bands, and volume-based measures. Traders usually combine a few tools to quickly identify entry points and manage risk.
