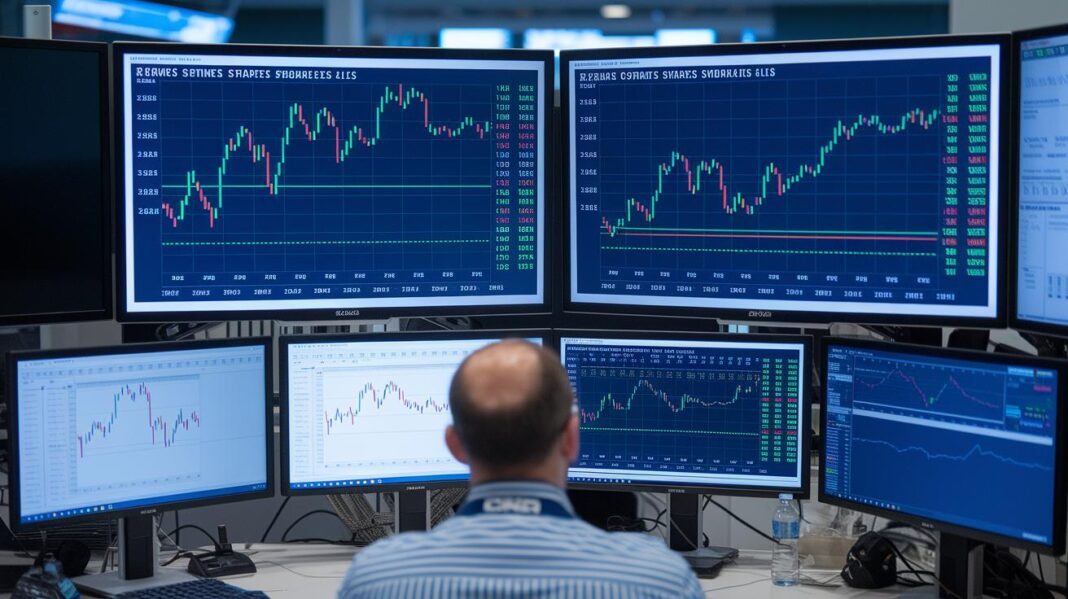
Have you ever wondered if our gut feelings or hard numbers tell us more about the market? Some folks say a burst of optimism can mean sunnier days ahead, while others rely on facts like profits and cash flows for guidance.
Here, we look at how mood trackers, like the Fear & Greed Index, a tool that shows whether investors are scared or excited, work side by side with solid financial data. In short, mixing quick, emotional insights with steady number-crunching might just lead to smarter investment choices.
Investor sentiment vs market fundamentals: Bright Insights
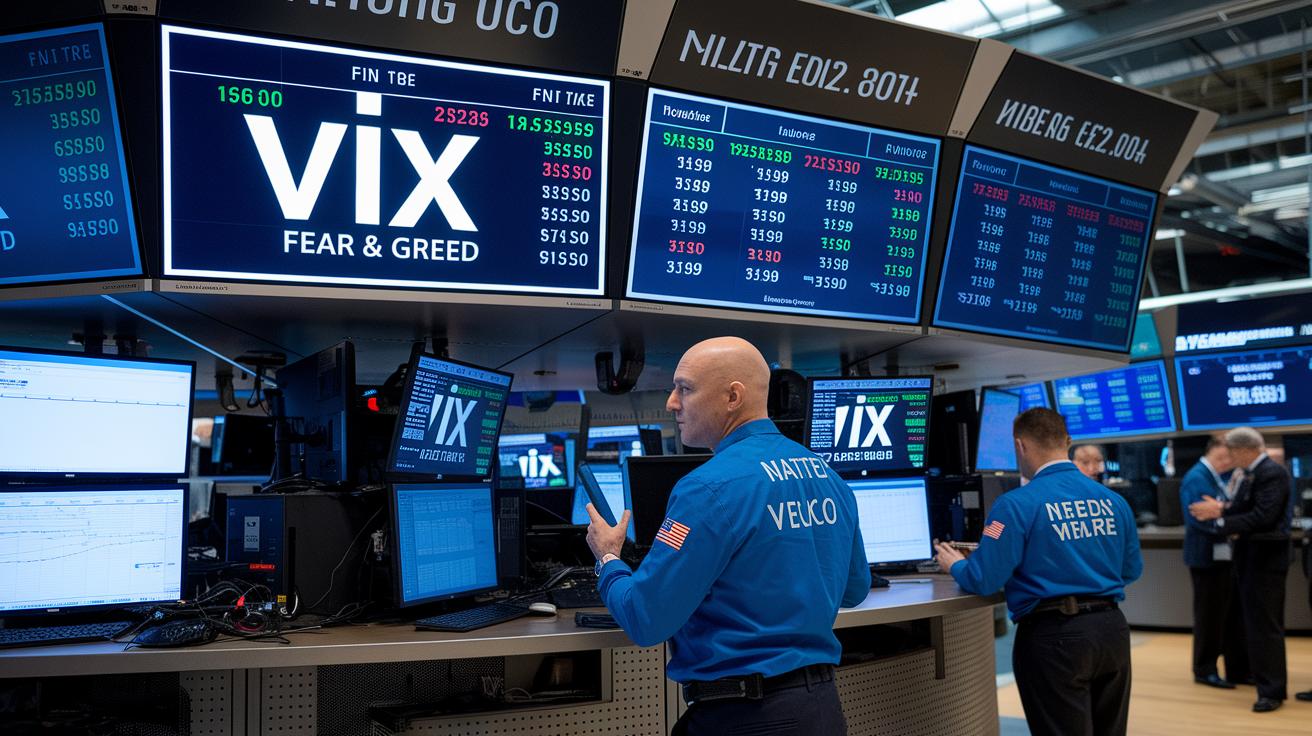
Investor sentiment shows us how traders feel about the market. It’s like checking whether a room is buzzing with energy or filled with caution. Tools such as the Consumer Confidence Index (a measure of how optimistic consumers are), the Bullish Percentage Index, and the Fear & Greed Index help us see if people are leaning toward rising prices or expecting a drop. Other signals, like the MOVE Index, Put/Call Ratio, and VIX, offer a look at short-term market jitters. For instance, a sudden jump in the VIX can feel a bit like sensing the first drops of a brewing storm, hinting that nervousness is in the air.
Market fundamentals, on the other hand, dig deeper into what an asset is really worth. This method involves looking at financial statements, cash flow trends, and key economic data, along with big-picture factors. Investors use metrics like price-to-earnings ratios, earnings growth, and cash flow to decide if an asset is priced fairly over time. Think of it as checking all the details of a recipe to make sure you get a well-balanced meal.
By mixing both strategies, you get a fuller picture of the market. Some investors rely on sentiment for quick moves, while fundamentals guide long-term decisions. This blend helps you capture the pulse of the market without losing sight of the true economic value behind each investment.
Measuring Investor Sentiment with Gauges and Indicators

Investors often dig deeper than the usual earnings or GDP numbers to feel a market's true pulse. They rely on special gauges that catch shifts in sentiment early, sometimes even before the usual measures ring the alarm.
- Consumer Confidence Index: This gauge uses surveys to check how upbeat consumers are. In the past, when it dipped, it often hinted at an economic slowdown before everyone else noticed.
- Bullish Percentage Index: This measure looks at how much of the market is showing a positive outlook. Many times, its rise has warned of upcoming strong, sustained trends.
- Fear & Greed Index: By blending market momentum and volatility (big price swings), this tool shows the overall mood. It’s been known to signal when the market hits its lowest lows during turbulent times.
- MOVE Index: This index keeps an eye on U.S. Treasury volatility, which reflects shifts in the fixed-income market (think government bonds). Its sudden spikes have sometimes marked broader market stress.
- Put/Call Ratio: This tool compares options trading activity to understand how investors are positioned. Historical trends suggest it’s pretty good at flagging overbought scenarios.
- VIX: Often called the fear index, it measures expected volatility in the stock market and acts like a warning siren, a sharp rise has often come just before short-term corrections, like a sudden stir in a quiet room.
Traders mix these extra insights with basic fundamentals like earnings reports to fine-tune their strategies. New tools like the Smart Money Index add real-time signals to the mix, complementing the old standbys. It’s interesting to remember that before making big moves, some investors noticed a spike in the VIX and treated it as an early warning, almost like catching a secret before it made the news.
Evaluating Market Fundamentals through Intrinsic Metrics

Fundamental analysis looks at a company's real financial picture. Investors dig into financial reports, economic data, and market trends to see how a business really works. For example, the P/E ratio compares a stock's price to its earnings (earnings show how much profit a company makes), while looking at revenue and earnings growth gives you an idea of how strong the performance is. It’s a bit like watching a well-tuned engine run without a hitch.
Free cash flow tells you how much money is left after the company spends on growth, ROE (return on equity, which shows how well a company uses its money from shareholders) reveals profit strength, and the debt-to-equity ratio explains how much a company relies on borrowing compared to its own assets. When these numbers steadily improve, it can boost investor confidence, much like discovering a hidden gem that underlines trust in the company’s potential.
| Metric | Description | Typical use case |
|---|---|---|
| P/E ratio | Compares a company’s share price to its earnings per share | Assessing valuation |
| Earnings growth | Tracks increases in revenue and net income (earnings reports impact on equity markets) | Evaluating performance trends |
| Free cash flow | Measures cash remaining after capital expenses | Understanding liquidity (how easily an asset can be converted to cash) |
| ROE | Shows profitability relative to shareholder equity | Comparing profit efficiency |
| Debt-to-equity | Compares total liabilities to owners’ funds | Analyzing financial leverage |
Using these key metrics, investors can spot companies that are fairly priced and financially strong. Think of it like choosing the best ingredients for your favorite meal, each measure adds a bit more flavor to the overall picture, helping guide smart, long-term decisions with clear, down-to-earth confidence.
Investor Sentiment vs Market Fundamentals in Real-World Case Studies

Real market events show us that investor mood can drive sudden price shifts, while solid financial data offers a steadier path for long-term growth. I once wondered how emotions and hard numbers can clash, and experts Michael Zeuner and Sam Sudame did just that in a recent Wealth Enterprise Briefing. They shared two eye-opening examples that help us see how feelings sometimes override facts and, other times, are balanced by them.
Case Study: April 2024 Turbulence
In April 2024, the market felt like a roller coaster. Fear quickly spread, with the VIX index (a measure of market worry) spiking and pushing traders to sell off positions in a hurry. Even though the core numbers, like earnings growth and stable cash flows, stayed strong, many investors got caught up in the moment and left too early. It’s a clear reminder that following the market’s emotional ups and downs can sometimes lead you astray from what the numbers say.
Case Study: Secondary Market Trends 2025
Fast forward to 2025 and the picture changes. Despite some gloomy signals from sentiment gauges during periods of mixed economic news and rate changes, companies that showed strong revenue and smart strategies kept their prices moving upward. Steady trade volumes and a sense of optimism helped smooth out the temporary dips in mood. Investors saw firsthand how consistent cash flows and robust earnings can counterbalance a brief emotional downturn, even when the public mood seemed less hopeful.
In short, these cases teach us that while emotions can cause quick price drops, as seen in April 2024, a blend of feelings and fundamentals can maintain balance and stability, like in 2025. This balanced view helps investors track real-time trends while keeping an eye on long-term value, paving the way for smarter choices in ever-changing market conditions.
Integrating Investor Sentiment and Market Fundamentals into Strategy

Successful investors know that mixing trading signals from gut feelings with solid fundamentals gives you both timing and quality for smart choices. By pairing live mood indicators with earnings schedules and big-picture economic reports, you can build a strategy that captures the current market vibe while honoring an asset’s long-term strength. Comparing quick number checks with a deeper look into a company turns plain data into clear signals that track both momentum and real value.
First, find top assets by checking core metrics like cash flow, earnings reports, and growth rates. Also, keep an eye on sentiment measures such as the Fear & Greed and Bullish Percentage Index (which show how investors are feeling). This helps you see that an asset is not only attractively priced but also backed by a positive market mood.
Next, match your chosen assets with live sentiment signals to fine-tune your entry and exit points. Use a data-driven approach to compare the market’s mood with key fundamentals, making sure that short-term price moves don’t distract you from the asset’s long-term worth.
Then, build your trading signals by blending mood indicators with earnings calendars and macroeconomic updates. This mix of real-time cues and solid core data creates a balanced alert that guides your investment moves with both speed and precision.
Lastly, keeping a close watch on your strategy is key. Continually adjust your approach by tracking both immediate sentiment shifts and evolving fundamentals, so you stay on track through market ups and downs.
Limitations of Investor Sentiment and Market Fundamentals

Sometimes, investor mood indicators don’t tell the full story because they rely on personal feelings that can be less logical. We might use these signals and end up making quick moves without checking what’s really going on. For instance, a sudden jump in a fear measurement can spark quick sell-offs, even when deeper trends are steady.
Often, trades are swayed by the market's mood rather than solid financial checks. When decisions are made just on the vibe, there’s a risk of missing out on real, underlying value, kind of like picking a snack purely because it looks fun, without knowing if it’s good for you.
At the same time, fundamental analysis has its own issues. Companies sometimes delay their financial reports or mess up the numbers, which means the figures you see can be a step behind what’s happening right now. This lag might cause investors to miss early signs of a market shift.
In short, even strong long-term data might not pick up on rapid changes in the economy. Relying only on these traditional numbers can leave investors exposed when quick adjustments take place.
Practical Blueprint for Balancing Sentiment and Fundamentals

Building a solid portfolio starts by setting clear targets on how you split your investments. For example, you might choose a simple 60/40 mix between value and growth stocks. This mix is based on solid numbers like the price-to-earnings ratio (P/E, which compares a company’s stock price to its earnings) and how quickly earnings are growing. Once you have this base, you add another layer by watching market sentiment, like the Consumer Confidence Index, which shows how optimistic people feel about the economy. This gives you a hint about when to be more cautious or when to seize opportunities.
- First, use core financial measures to decide how much to invest in each asset so that every part of your portfolio meets a quality standard.
- Next, set specific sentiment levels as signals to adjust your mix, such as moving toward safer choices during uncertain times.
- Regularly check key figures like the P/E ratio and consumer mood metrics to keep up with both solid financial data and market feelings.
- Finally, maintain a flexible rebalancing plan that allows you to make tactical shifts without losing sight of your long-term goals.
Keeping a close watch on both the hard numbers and the overall market mood is vital. By reviewing these regular checks, you can spot early signs that it might be time to rebalance your portfolio. This approach helps you stay stable while also taking advantage of new opportunities as market feelings change.
Final Words
in the action our discussion compared market mood with core financial data. We looked at sentiment gauges, key valuation metrics, and real-world examples to show how these ideas come together. Small shifts in investor sentiment can steer timing, while solid fundamentals guide long-term choices.
Balancing investor sentiment vs market fundamentals helps you shape a more resilient portfolio. Keep exploring these insights to stay confident and ready for what the market brings next.
FAQ
What is market sentiment Reddit?
Market sentiment Reddit reflects the overall mood shared by investors on Reddit. It shows how online discussions and opinions can signal short-term shifts in market prices and influence trading decisions.
What does the GameStop case tell us about company fundamentals versus sentiment-driven pricing?
The GameStop case reveals that market pricing can sometimes be driven by investor emotions rather than solid company data. It highlights the clash between strong financial metrics and sentiment-fueled stock moves.
What is the difference between market sentiment and fundamentals?
Market sentiment captures investors’ overall mood about future price movements, while fundamentals focus on key financial figures and economic data to determine an investment’s true worth.
What is investor sentiment?
Investor sentiment shows the collective feelings of the market. It gauges whether investors feel optimistic or cautious, using indicators that reflect rapid shifts in market mood.
Does investor sentiment really matter?
Investor sentiment matters because it can trigger short-term price changes. While core financial data drives long-term value, market mood helps traders decide when to buy or sell.
What is the 7% rule in investing?
The 7% rule sets an expected average annual return of about 7%. It serves as a benchmark to compare potential investment gains against established market performance targets.
