
Have you ever noticed how the mood of the market can change our financial future, especially when times are unpredictable? When investors start feeling a bit unsure, it’s like the weather suddenly shifting, bringing with it new opportunities and a hint of hope. Simple tools, such as weekly surveys and volatility indicators (which show how much prices are bouncing around), help us pick up hidden clues in these market swings. These hints can guide us on when to tweak our plans and deepen our understanding. In short, learning to read market feelings during uncertain times might just light up a promising path forward.
Interpreting market sentiment in uncertain times yields hope

Market sentiment is really the mood investors carry into the market. It’s like the heartbeat of trading that can push prices up or pull them down. For instance, before a big reversal in the market, extreme readings in the AAII Investor Sentiment Survey often show up as a warning sign that moods might change suddenly.
Investor confidence numbers are key to understanding these shifts. The AAII Investor Sentiment Survey collects thousands of responses from everyday investors each week, starting from early Thursday and wrapping up by Wednesday night. The results come out every Thursday morning at 9:30 ET. This survey gives a quick look at whether investors lean more optimistic (bullish) or pessimistic (bearish), and it signals caution when feelings hit extreme highs or lows.
The CNN Fear & Greed Index is another helpful tool. It combines seven different market signals, including technical momentum and the VIX (a measure of how wildly prices might swing), to score the market from 0 to 100. Meanwhile, the NAAIM Exposure Index tracks the weekly net stock exposure of active U.S. managers, assessed when the market closes on Wednesdays. When these readings hit extreme levels, they often point to a time of increased volatility and possible short-term reversals, offering practical tips for trading during tense times.
By putting these benchmarks together, you can get a clearer picture of the market’s mood. For example, if you see an extreme flip in sentiment, it might be a signal to play against the crowd. After all, being overly confident can be just as risky as being extremely pessimistic.
Market Sentiment Indicators and Volatility Forecasting Methods
Market sentiment is more than just a vague feeling. It moves prices and gives us clues about upcoming changes in volatility. One key tool is the VIX, which estimates future price swings by looking at market expectations. When the VIX goes up, it suggests that traders might soon see more rapid price changes.
Breadth indicators, like advance/decline lines and counts of new highs versus new lows, also play an important role. They help form the CNN Fear & Greed Index, which captures the mood of the market. Research shows that when fear or greed reaches extreme levels, it often lines up with times of high volatility.
Moving-average crossovers in sentiment data add another layer of insight for short-term price changes. When these signals match up with economic numbers like GDP surprises or shifts in unemployment, they provide a clearer picture. These economic details help explain how global trends mix with market mood, leading to sudden changes in trading.
By combining these technical signals with solid economic data, investors get a well-rounded view of what might happen next. This approach makes it easier to adjust strategies quickly whether changes are subtle or more pronounced. Markets truly tell their own story.
Behavioral Finance Signals for Interpreting Market Sentiment
Market sentiment isn’t just about numbers; it also reflects real human behavior. When surveys like the AAII show extreme optimism or pessimism from everyday investors, it might be a hint that the crowd is following the herd a bit too blindly. In plain terms, if everyone’s overly upbeat or gloomy, it could mean they’re about to get it wrong, a bit like a tug-of-war between feelings and facts.
Then there’s professional positioning, which you can see through the NAAIM Exposure Index. This handy index shows whether seasoned managers are ramping up their investments or easing off in anticipation of tougher times. Simply put, it gives you a look into how the pros are feeling about the market right now.
Research into what we call Knightian uncertainty (a way to measure how unpredictable stock returns can be because of shifting moods) tells us that sudden mood swings can lead to quick market turnarounds. Plus, common mental shortcuts like herding, where people just follow the group, and loss aversion (that deep fear of losing money) only make these swings even more dramatic.
Studies by experts like Roman Frydman and Nicholas Mangee back up these observations. Their work shows that by understanding these behavioral signals and the psychology behind trading, you get a richer picture than what raw numbers alone can offer.
Risk Management and Volatility Hedging in Uncertain Market Sentiment
When market moods become really extreme, it's smart to have a solid plan in place for managing risk. One reliable idea is to use VIX futures or options, which help protect you when sudden drops hit after periods of intense fear or greed. The VIX tells you how much the prices might swing soon, it’s like an early warning system that lets you act before losses grow too big.
Another handy tool is the protective collar. When surveys like the AAII Investor Sentiment Survey show that bullish feelings are well above 60%, these collars put clear limits on your potential losses, even if the market is buzzing with overconfidence. In short, they trim your exposure when a market pullback seems likely.
Dynamic rebalancing is yet another step to keep your portfolio safe. By shifting your investments based on weekly updates from the NAAIM Exposure Index, a measure that shows how much money managers have committed, you can adjust your holdings to match current market feelings. For instance, if the overall sentiment slips into a deep fear zone, moving some funds into Treasury bills or gold can help protect your portfolio, as these assets often hold up better during wild market swings.
- Use VIX futures or options to get an early look at price volatility.
- Activate protective collars when bullish sentiment tops 60%.
- Shift into defensive assets with dynamic rebalancing techniques.
Integrating Economic Data and Media Mood Extraction in Sentiment Analysis
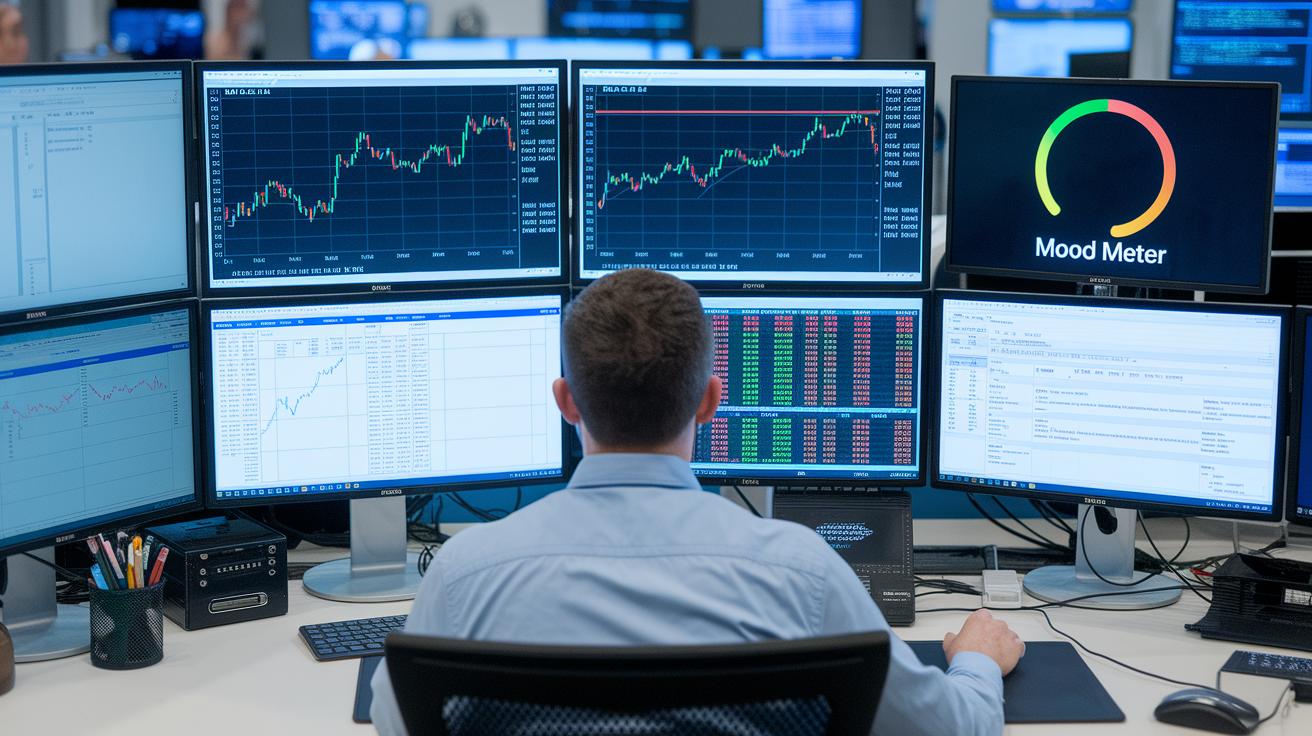
Markets don’t just react to numbers; they also feel the vibe of the day. Think about key stats like GDP surprises, inflation trends, and job numbers. These figures set the stage and tell us where the economy stands. Remember that one week when an unexpected inflation headline shifted investor moods so fast it sent prices soaring almost instantly?
Today, computers help us catch the mood by scanning news headlines and social media posts. They turn words into numbers, showing if a story feels positive, cautious, or negative. Studies even suggest that these mood scores can hint at market moves up to 24 to 48 hours before they happen, pretty neat, right?
You often see these mood spikes kick in during big fiscal stimulus talks or after important rate changes. When you blend traditional economic figures with real-time media feels, you get a much clearer picture of the market’s heartbeat. This balanced view helps investors read the economic room and decide wisely, especially when both hard data and public sentiment are key players.
Crisis Period Trading Cues and Dynamic Asset Revaluation
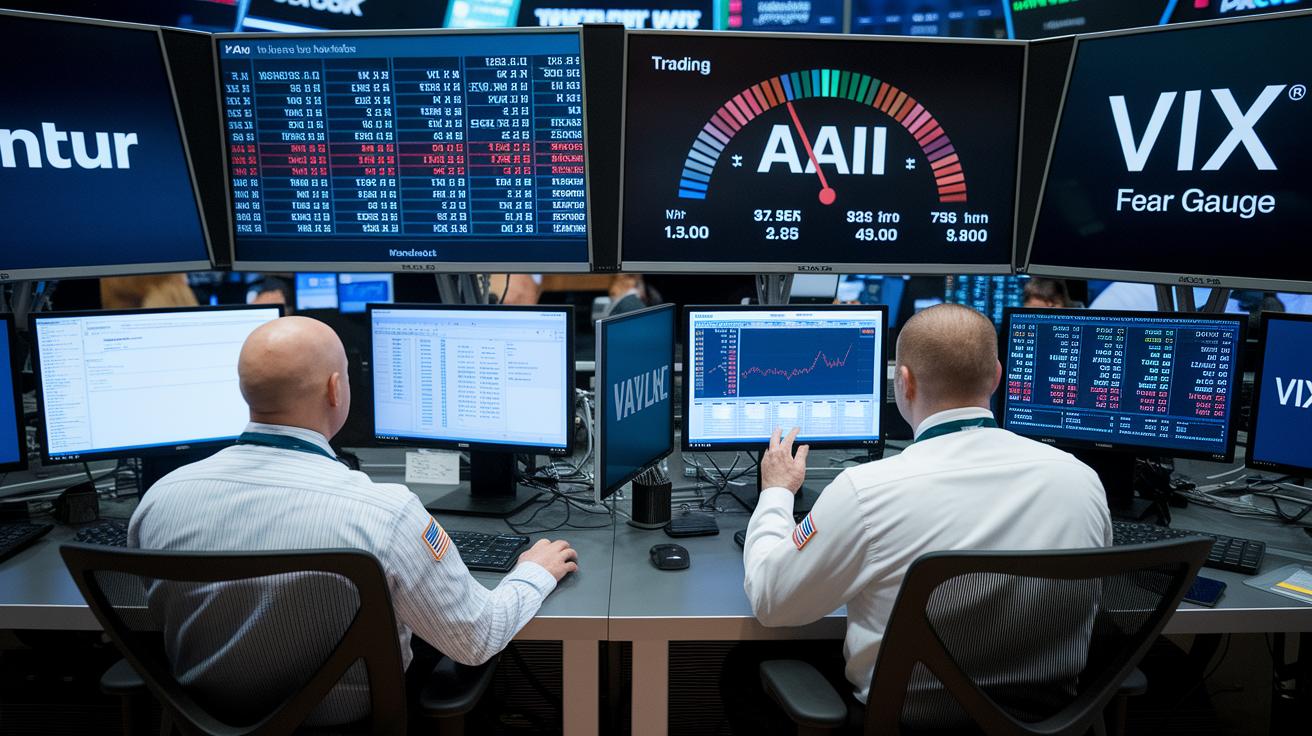
Sometimes the market shifts quickly when things get tough, and simple signals can help you know when to act. For example, when AAII fear readings (a gauge of investor worry) jump suddenly during regional bank issues, it might be a sign that rough times are coming. In these moments, traders might even spot chances to go against the trend. Similarly, when unexpected runs on uninsured stablecoins and sudden shocks in crypto-derivatives occur, the VIX (a measure of market fear) often jumps, showing that the market is changing fast.
In addition, watching real-time liquidity, like widening bid-ask spreads (the gap between buying and selling prices), can reveal how external shocks are affecting trades. This information gives investors a clear picture of how liquid the market is during a crisis. Some experts even share tips through weekly webinars and case studies, suggesting that timing trades using CNN and NAAIM readings can be very helpful when the market is stormy.
In short, by blending sentiment data with quick asset revaluation insights, traders get practical cues for crisis trading. So if you see stablecoin panic causing a VIX jump, keeping a close eye on bid-ask spreads might guide you to make timely, defensive moves. These clues can really help you make quick and smart decisions when things get wild.
Final Words
In the action, we covered a range of tactics that bring clarity to market moods. We examined key indicators like the AAII survey, CNN Fear & Greed Index, and NAAIM Exposure, paired with risk management tools, and even economic and media signals. Each section offered practical ways to protect and refine digital portfolios. The insights here drive smart moves while emphasizing the importance of interpreting market sentiment in uncertain times. Keep a steady approach, and watch those strategic ideas drive your investment success.
FAQ
What does the PDF on interpreting market sentiment in uncertain times cover?
The PDF explains how investor mood, measured by surveys and indexes, ties into price movements and volatility forecasting. It offers clear strategies to help guide decisions during periods of uncertainty.
What does a bullish sentiment index show?
A bullish sentiment index shows an overall feel of optimism, indicating that many investors expect prices to rise. This guide can help in adjusting tactics during positive market moods.
What is a sentiment trading strategy?
A sentiment trading strategy uses mood signals from key surveys and indexes to spot potential reversals or volatility. This approach gives investors practical insights for short-term trading decisions.
What does commodity market sentiment mean?
Commodity market sentiment reflects the overall mood in markets for raw materials by tracking supply, demand, and price expectations. It acts as a guide for understanding market conditions in these sectors.
How is market sentiment defined on Wikipedia?
Market sentiment on Wikipedia is defined as the collective mood that drives investor behavior and price trends. This concept serves as a barometer for assessing overall market health.
What does bearish sentiment indicate?
Bearish sentiment indicates a prevailing tone of caution, where more investors expect a drop in prices. Recognizing this mood can offer investment cues during periods of market pessimism.
What is IG client sentiment?
IG client sentiment tracks the overall outlook of traders on the IG platform by quantifying their bullish or bearish bias. This insight helps to spot trends and potential shifts in market behavior.
What is the Baker and Wurgler sentiment index?
The Baker and Wurgler sentiment index measures investor mood using market data and behavioral indicators. It helps to explain how collective emotions may correlate with stock price movements.
