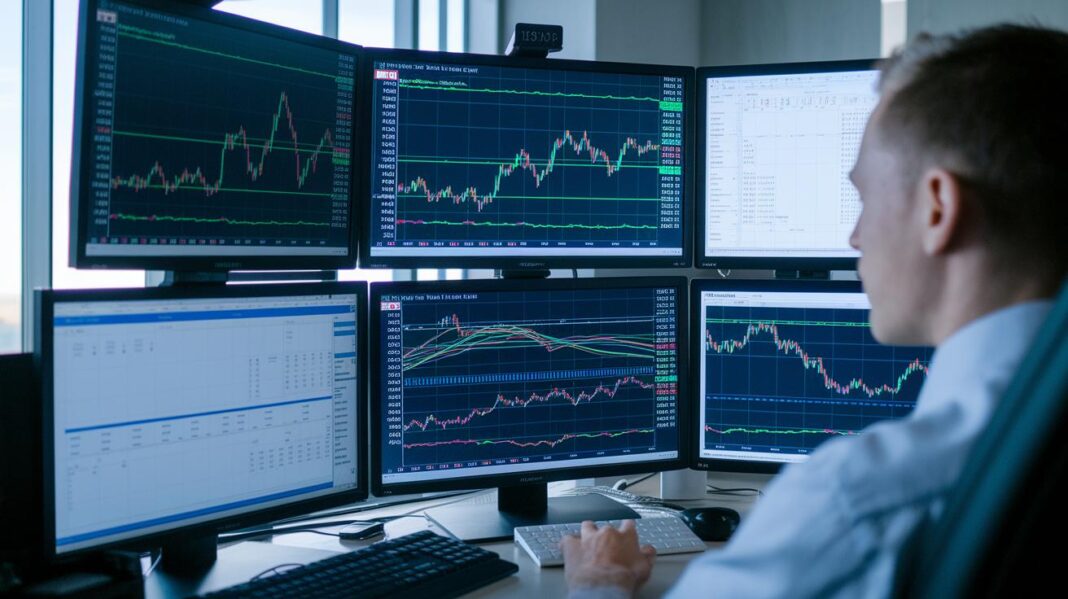
Have you ever thought that market charts might hide clues that could change your trading plan? Advanced technical analysis (methods that use past market data to predict future trends) shows details that basic charts simply miss. Imagine it like using a powerful lens that brings hidden patterns into clear view. With smart tools and reliable data, traders can spot early shifts before market trends fully develop. Today, we take a closer look at these techniques to help you see movements more clearly and make smarter trading decisions.
Building Blocks of Advanced Technical Analysis Techniques
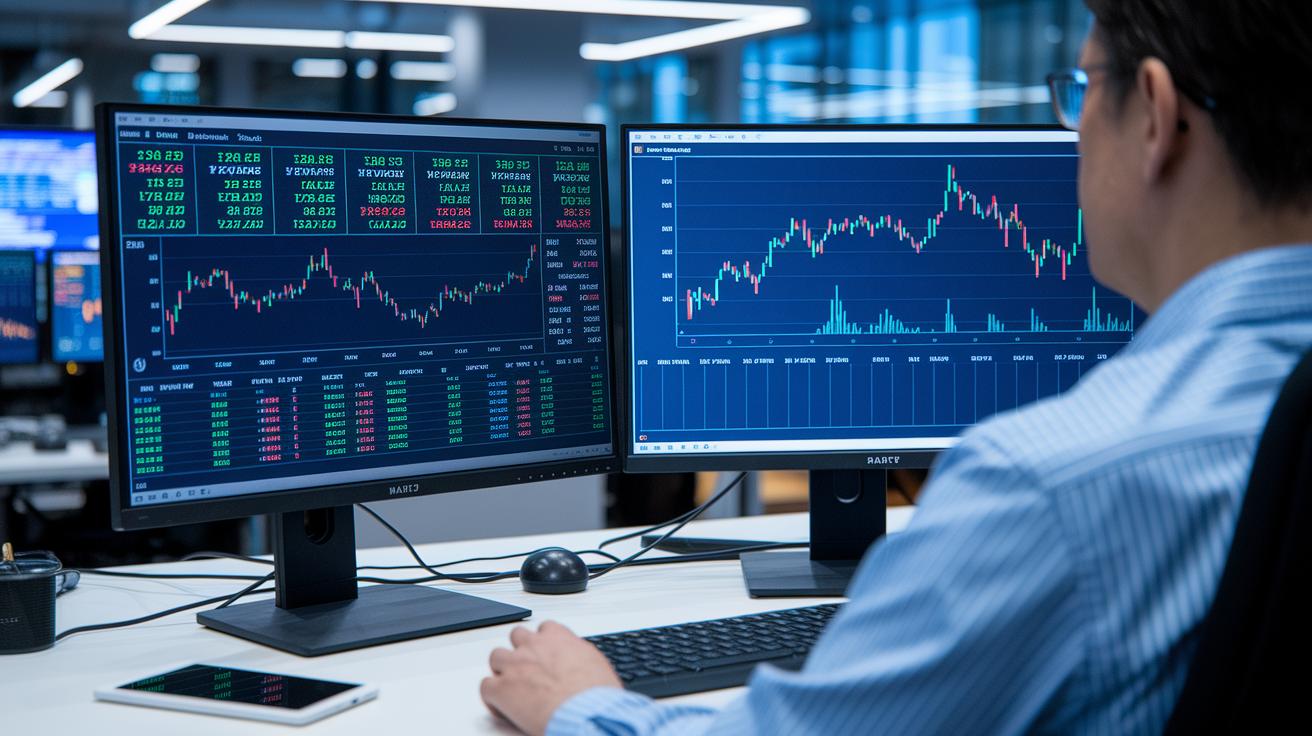
Modern trading relies on smart tools that bring clarity to fast-changing markets. Today’s investors use innovative analysis and systematic methods to keep up with the shifting balance of supply and demand. For example, pulling Level II data (detailed market information) on TradingView can show you big bid-ask gaps and hidden iceberg orders. And machine learning models, essentially computer programs that learn from data, spot subtle patterns that traditional charts sometimes overlook. Platforms like StockCharts.com, Stock Rover, and Trade Ideas blend many techniques, from looking back at historical trends to analyzing advanced candlestick patterns, to give traders a clear view of market trends.
- Algorithmic strategies
- Pattern detection
- Statistical tools
- Momentum/volatility analysis
- Chart innovations
- Risk/backtesting frameworks
These categories capture the heart of today’s technical analysis toolkit. Algorithmic strategies use computer-based models to read complex signals quickly. Pattern detection clears out the market noise with charts like Renko and geometric forecasts that follow Gann’s principles, sharpening the quality of the signals. Statistical tools such as Fibonacci retracements and Bollinger Bands make it easier to see support and resistance levels or notice changes in volatility. Tools for momentum and volatility, like MACD and refined candlestick patterns, help pinpoint turning points in the market. Chart innovations simplify trends by filtering out the clutter. And risk and backtesting frameworks let traders check their ideas against historical data and set flexible stop-loss levels to manage risk.
In real-world trading, these elements work together to guide better decisions. A trader might blend insights from a machine learning model with signals from statistical indicators, then double-check these moves with order flow data. This mix of systematic strategies turns complex market signals into clear, actionable steps for confident trading.
Algorithmic and Quantitative Strategies in Advanced Technical Analysis

Machine learning on TradingView is a handy tool for spotting small market patterns that might otherwise go unnoticed. These smart systems dig through huge amounts of data to catch trends. They use two main methods: one is supervised learning, which means predicting trends based on past data, and the other is unsupervised clustering, which groups similar market behaviors together to spot new changes. They also use time & sales confirmation, a way to double-check that what they see is really happening. Imagine a model sifting through thousands of trades to pick up a tiny signal that later turns into a big trend. It’s like having a diligent helper that makes your forecasts more reliable.
Automated trading systems and neural network techniques take this even further. Automated systems follow set rules to make trades instantly, so they react quickly when the market changes. Neural networks, which are computer programs designed to learn from data, test many scenarios at once, almost like a smart friend giving you advice on the best time to act. Together, these tools bring a unique mix of fast, rule-driven action and thoughtful, human-like insights to advanced technical analysis.
Advanced Indicator Optimization: Fibonacci to Adaptive Moving Averages

Calibration is like tuning your favorite instrument. It helps adjust technical tools so they mirror how the market really behaves. By tweaking standard Fibonacci ratios, which show us potential support, resistance, and reversal points, you can get a clearer picture of when the market might shift. For example, matching these Fibonacci levels with the market’s current mood can hint at when prices may bounce back or turn around. This fine-tuning cuts down on delays and makes signals more trustworthy, giving traders more confidence amid market ups and downs.
| Ratio | Use Case |
|---|---|
| 0.236 | Helps spot the first signs of support or resistance |
| 0.382 | Offers an early clue that a reversal might be coming |
| 0.500 | Marks the mid-level reaction area |
| 0.618 | Highlights strong areas for reversals or continuations |
| 0.786 | Signals a solid pullback confirmation point |
Adaptive moving averages take this one step further. Unlike old-school averages, these smart indicators change their smoothing settings based on how wild or calm the market is. (Smoothing here means keeping the data smooth to see the trend, much like ironing out wrinkles for a clear view). By using calculations like the efficiency ratio, traders can tell the strength of a trend and decide when to jump in or step out. This adjustment helps catch quick market moves while staying steady during quieter times, all of which can boost trading performance in different conditions.
Volatility and Momentum Oscillators: MACD, RSI, and Beyond

RSI helps traders figure out if a price is too high or too low by comparing gains with losses over 14 days. When the RSI is above 70, it suggests the asset might be overbought, and when it’s under 30, it hints at being oversold. Sometimes you’ll see a situation where the price makes lower lows while the RSI starts making higher lows. That’s a little nudge to take a closer look at what market mood is doing.
MACD works by looking at the gap between two moving averages, one calculated over 12 days and the other over 26 days. When the MACD line moves above its 9-day signal line, it’s a signal that might be a good time to buy. Conversely, if it dips below that line, it might be time to think about selling. It’s a bit like checking the market’s pulse, quick shifts there can guide your entry or exit.
Bollinger Bands mix a 20-day simple moving average with two lines set 2 standard deviations away. When these bands squeeze closely together, it hints that a big price move could be just around the corner. And if prices wander too far from the average, they tend to swing back, which is where mean reversion comes in. For a deeper dive into reading these signals, check out “How to Interpret Trend Analysis Results” at https://tradewiselly.com?p=2624.
These tools take the everyday jumble of market data and turn it into reliable clues. They give traders a clear framework to navigate those sudden shifts in a lively market.
Advanced Charting Methods: Renko, Gann, and Smart Drawing Tools

Renko charts skip tracking time and focus only on price moves. They create blocks each time prices hit a set move, which helps you see the bigger shifts and breakout signals. A trader, for example, might notice a breakout above resistance much more clearly with a Renko chart than with a traditional candlestick chart. This approach cuts through market clutter and gives a sharp view of trend changes during wild swings.
Gann’s method uses a geometric style that links time with price through specific angles. By plotting these angles, traders can get a feel for when trends might turn or where prices might land next. For instance, a trader might see that a 45-degree angle has marked reversal points in past market moves. This angle-based method adds a solid, number-driven tool to help understand price patterns.
Smart drawing tools make charting even easier. Tools like Fibonacci fans (which use a sequence of numbers to find support and resistance), Andrews’ pitchforks (which help you trace trend directions), and regression channels (which show the overall trend) let traders mark key levels on charts. A trader might use an Andrews’ pitchfork to line up old pivot points and uncover potential breakout paths. Using these handy tools turns advanced charting into a practical process, making it simpler to spot trend shifts and act on breakout signals.
Volume Analysis and Order Flow Techniques for Precision Trading
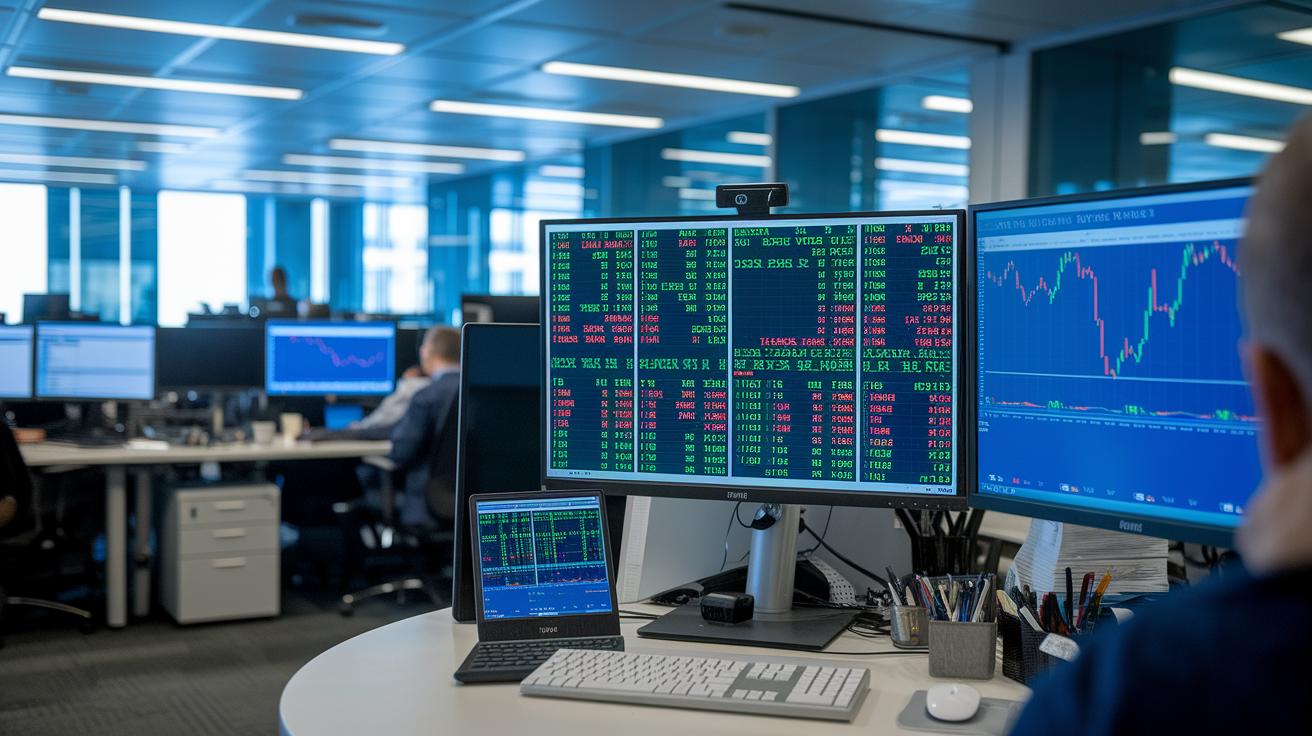
Reading Level II data gives you a behind-the-scenes look at what big players are doing. It shows you large bid-ask spreads and hidden iceberg orders (orders partly hidden so as not to move the market drastically) that can shift prices. By checking out a detailed order book and matching it with time & sales, a live record of every trade, you get a clearer view of where these big players are active. It's like feeling the steady pulse of the market, where each tick tells you if pressure is building or easing.
Next, you can use volume patterns and study bar action on intraday charts. This method confirms the strength of a trend and helps you figure out key price levels. When you notice volume spikes and see differences between price and volume on each bar, you start to see emerging support or resistance zones. Putting all these clues together with order flow data gives you a more complete picture of current market conditions, similar to what professionals use on advanced trading platforms.
Implementing Backtesting and Risk Control Frameworks

Running a thorough backtest can really change the game when you're fine-tuning a trading strategy. Start by picking periods from the past where you can mimic market behavior. Then, try out several settings to see which work best over time. Next, use walk-forward analysis, in simple terms, test your strategy on data it hasn’t seen yet to check its strength. In practice, this means running loads of simulations while keeping a careful eye on the results. A research note from August 04, 2024 reminded us that FOMO (fear of missing out) can trick traders, so sticking to a disciplined backtesting routine helps you spot real signals in the market buzz.
After that, secure your moves with a clear risk control plan. Instead of sticking to fixed exit points, adopt dynamic stop-loss techniques that adjust as the market shifts. For example, you might use ATR volatility bands (ATR here tells you how much the price typically moves, giving you an idea of market turbulence) to set smarter stop-loss levels. Filtering signals with a mix of indicators can also cut down on mistakes. By routinely refining your plan based on performance checks, you help dodge those emotional decisions. This methodical process transforms raw market data into clear insights, giving you a steady edge even when conditions change quickly.
Final Words
In the action, the blog explores a range of market tools, from algorithmic strategies and adaptive moving averages to order flow and historical backtesting protocols. It presents a clear view of how refined techniques, such as advanced technical analysis techniques, turn detailed signals into real-world trading insights. Each section builds on the idea of smart data use and risk control to help create a diverse, secure digital asset portfolio. Keep experimenting and refining your approach, there’s always fresh potential ahead.
FAQ
Advance Technical Analysis PDF
The Advanced Technical Analysis PDF explains sophisticated methods like algorithmic strategy integration, advanced charting, and risk control frameworks to help traders fine-tune their decision-making.
Advanced technical analysis book
The advanced technical analysis book offers detailed insights into modern trading techniques, covering topics from adaptive indicator calibration to historical backtesting for improved market predictions.
Advanced trading chart analysis with AI
Advanced trading chart analysis with AI involves using machine learning to filter market noise, detect subtle patterns, and enhance predictive accuracy for real-time trading decisions.
Technical indicators list
The technical indicators list outlines essential tools such as Fibonacci retracements, Bollinger Bands, MACD, and RSI, each designed to assess momentum, volatility, or trend strength.
Top 20 trading indicators
The Top 20 trading indicators detail popular tools ranging from candlestick patterns to momentum oscillators, providing traders with a varied set of metrics to validate entry and exit points.
Technical indicators in stock market
Technical indicators in the stock market incorporate measurements like MACD, RSI, and volume-based signals to help traders identify trend directions, support areas, and possible reversals.
4 types of technical indicators
The four types of technical indicators include trend-following, momentum, volatility, and volume-based metrics, each assisting traders in analyzing different aspects of market behavior.
Best technical indicators for day trading
The best technical indicators for day trading often feature fast-reacting oscillators like RSI and MACD, which help capture short-term price movements and timely market shifts.
What is advanced technical analysis?
Advanced technical analysis involves using refined strategies such as algorithmic pattern detection, machine learning predictions, and statistical backtesting to interpret market trends more accurately.
What is the 50% rule in trading?
The 50% rule in trading explains that when a price retracement reaches roughly half of a previous movement, it often marks a potential pivot level, suggesting support or resistance.
Which indicator is 100% accurate?
No indicator is 100% accurate; technical analysis relies on combining several indicators to reduce errors and increase the likelihood of successful market predictions.
What are the techniques of technical analysis?
The techniques of technical analysis include chart pattern recognition, volume analysis, oscillator evaluations, and risk management strategies, all of which help guide effective trading decisions.
