Ever wondered if the market’s mood can hint at an upturn or downturn? Some traders use how investors feel, mixed with real numbers, to decide when to make a move.
It’s a bit like checking the forecast before picking your outfit. They watch for changes in confidence and worry, which helps tell them when it might be the right time to act.
By mixing hard data with a human touch, this approach helps point out the best opportunities. Next time you look at the market, consider how feelings and figures can work together to guide smart moves.
How Sentiment Trading Strategies Work
Sentiment trading strategies combine easy-to-understand techniques and some number crunching to read the mood of investors. They take a look at price moves and other market actions to figure out if optimism or fear is in charge. In other words, it’s like checking the pulse of daily market chatter so you know when confidence is high or caution is taking over.
Picture this: when investors feel upbeat, prices tend to climb, creating a clear path for a bull move. On the other hand, if worry and doubt start to fill the air, prices might stall or even drop, hinting at a bearish trend. It’s a bit like checking the weather before heading out, a sunny forecast might encourage you to leave the house in shorts, while cloudy skies make you think twice about that picnic.
Here are some common tools traders use to read the mood of the market:
- VIX: It shows how wild or calm the market swings are; think of it as a thermometer for market energy.
- AAII Sentiment Indicator: This one takes surveys to reveal how individual investors are feeling.
- Consumer Confidence Indicator: It measures how optimistic everyday consumers are about the economy.
- Investors Intelligence Sentiment Index: It sums up the outlook from professional market advisors.
- Put/Call Ratio: This compares how many options contracts are being bought and sold to give a hint about overall sentiment.
- NAAIM Exposure Index: It indicates just how much risk professional investment managers are taking.
Many traders like to mix these sentiment tools with classic analysis techniques, such as looking at specific price points and trading volumes. This blend gives a richer picture by pairing hard data with the human side of investing. At the end of the day, tuning into market sentiment helps traders make smart moves that match the current financial vibe.
Constructing Sentiment Trading Signals: Data, Metrics, and Rules

Building a trading signal based on sentiment means starting with everyday financial news. First, you gather the feelings behind the headlines and then compare the daily score to a 7-day moving average. Think of it as collecting notes from trusted news about a company like Apple from late September to mid-October 2024. Group the scores by date so the overall picture isn’t lost in a sea of numbers. When today's score is higher than the 7-day average and stays positive, it tells you to go long when the market opens the next day. This approach cuts through the short-term jitters and brings out the real market mood.
| Step | Description |
|---|---|
| Data Source | Uses a financial news API to pull headlines, dates, and sentiment scores – for example, Apple Inc. news from 2024-09-26 to 2024-10-16. |
| Aggregation Method | Group daily sentiment scores to find an average for each day. |
| Rolling Average Calculation | Calculate a 7-day moving average to smooth out the short-term ups and downs. |
| Entry Rule | Buy, or go long, when today’s average beats the 7-day average and stays positive. |
| Exit Rule | Sell at the end of the trading day after the entry is triggered. |
Setting clear thresholds and checking your data regularly is a must. Many traders tweak these numbers based on how much risk they’re willing to take and the market’s mood. Adjusting the 7-day average and the entry criteria helps keep the signal in tune with current trends. In short, try out different intervals for reviewing your data until you find one that fits your trading style perfectly.
Evaluating Sentiment Trading Performance with Backtesting Results

We ran a test on a trading system that uses market mood to make decisions. Using Python, the system checked daily signals, noted gains or losses, and compared the overall results with a basic buy-and-hold method. It focused on Apple Inc. (AAPL) during the period from September 26, 2024, to October 16, 2024. This time frame helped capture the everyday shifts in market mood based on news scores.
In this test, the system generated signals by comparing the day’s average feeling with the past week's average. When the current day’s sentiment was higher than the 7-day average and was positive, the system took a long position and held it until the next day ended. This clear, rule-based approach achieved a return on investment of 4.27%, which beat the simple buy-and-hold strategy. It shows that using market mood can pick up on subtle shifts better than sticking to a fixed plan.
Still, it’s important to note that these results come from a small and short test period. Testing over longer spans and in varied market conditions can give a better look at how reliable and useful this type of trading strategy might be.
Integrating Sentiment Indicators with Technical Analysis for Better Signals

Blending market mood with traditional chart techniques creates a strategy that catches both slow changes and quick moves. When you mix sentiment data with technical analysis, you uncover trading opportunities that show true market strength or weakness. It’s like reading both the market’s feelings and its actions on the chart.
Sentiment measures work well over longer stretches, catching the steady hum of investor optimism or caution over several months. On the other hand, tools like RSI (which shows how quickly prices change) and MACD (a tool to track momentum and trends) are great for spotting short-term moves. For example, when sentiment climbs at the same time a price breaks through a key level, it usually signals a strong upward trend. Adding insights from volume changes makes these signals even more trustworthy. Websites like trend analysis indicators explained help you mix sentiment data with chart patterns, while tools such as market trends analysis show you the overall market push in one glance. This well-rounded approach can slice away false signals and trim out the noise.
Before you make any trading move, it’s a smart idea to double-check that your sentiment read is backed up by clear technical clues. Confirm that price breakouts and steady volume trends are in line with the sentiment view. Setting clear thresholds for both technical and sentiment signals is a tried-and-true tactic. This way, you can dodge the jitters of short-term market swings, get a clearer signal, and time your trades better.
Advanced Sentiment Modeling Approaches: From Crowd Metrics to Algorithmic Strategies

Advanced sentiment modeling turns the mood of the market into clear trading tips using computer rules, crowd behavior data, and extra indicators. Think of it like this: when using contrarian trading, you take a different stand when the market feels too excited or too gloomy. With momentum trading, you ride a wave of positive or negative vibes. And then there’s sentiment pattern recognition, which spots changes in the overall mood. These methods also bring in extra info such as the Commitment of Traders report (a look at big players’ positions) and 52-week high/low numbers to sharpen the analysis. Computer programs help keep all these rules in check and fine-tune when to act.
Contrarian trading spots moments when the market feels unreal either way. When sentiment numbers shoot up or drop too low, it hints that fear or greed might be taking over. For example, if everyone online seems super excited about a stock, a computer might signal that it’s time to consider a reversal. On the flip side, if the mood is very down, it might suggest that the price is close to bottoming out. It’s all about using crowd clues to detect when the overall feeling might be too extreme for comfort.
Momentum trading is a bit different. Here, the idea is to capture a steady trend. Computers keep an eye on the mood and ride the wave as long as the feeling, whether it’s optimism or caution, stays strong. Then there’s the method that watches for repeated mood shifts. By looking at past patterns, these systems set up simple rules to spot familiar moves and adjust when things reach certain levels. It’s like noticing that a familiar tune is playing and knowing just when to change the track.
Finally, choosing the right model depends on the type of asset you’re looking at and the specific market conditions. By tailoring strategies to fit the unique details of each investment, traders can fine-tune their signals to match the natural quirks of different markets.
Risk Management and Limitations of Sentiment Trading Strategies
When traders use sentiment-based strategies, they often face messy data and slow signals. News feeds can be confusing, with quick bursts of hope or worry that push the market to seem extreme. So, by the time a trader sees the signal, it might already be old.
Short-term ups and downs can also throw off sentiment readings. A sudden surge in media attention might make the market look too happy or too gloomy. This misleading mood can trick traders into following signals that don't match what’s really happening, making unexpected losses more likely. In fact, these signals work best when you look at them over a longer period rather than on the fly.
To fix these issues, traders put risk controls in place. They combine sentiment data with simple financial information like price patterns (how prices move) and earnings reports (how well companies perform). They use strict rules like stop-loss orders and decide ahead of time how much money to put into each trade. This way, one misstep won’t hurt the whole portfolio.
By keeping an eye on these controls and checking for biases, like being overly optimistic or letting a negative news cycle overtake clear thinking, traders can adjust their strategies when the market mood shifts.
Tools and Data Sources for Implementing Sentiment Trading Strategies
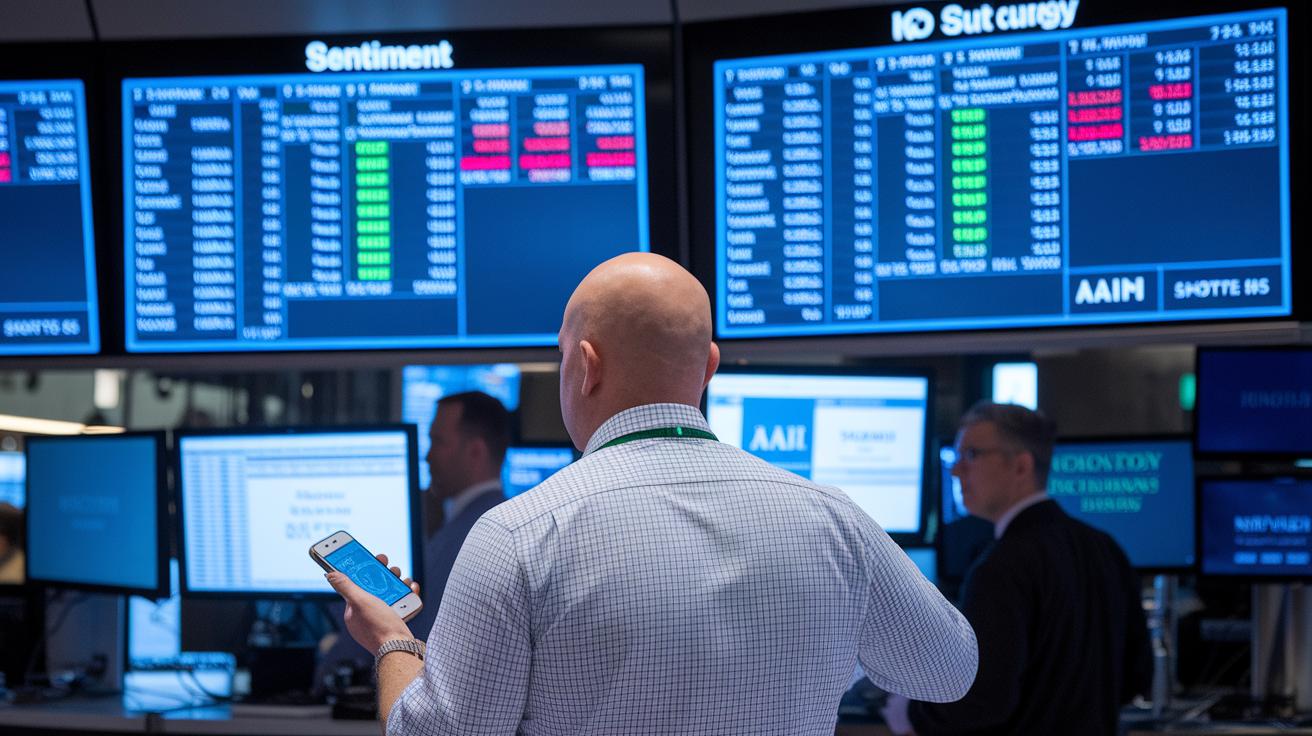
Sentiment trading depends on two main sources of data. One stream catches digital clues like news-sentiment APIs that score headlines as they happen. Picture this: when a major IPO surges, the API might tag the news as very positive in real time.
The other data source comes from traditional surveys such as AAII (American Association of Individual Investors, which surveys investor opinions) and Consumer Confidence reports. These show what individual investors are thinking.
Traders can build a solid sentiment feed by blending these digital cues with market signals that track price swings and investor actions. Digital tools provide instant impressions from news channels, while classic measures add more depth. For example, the VIX (a gauge that shows how much prices are fluctuating) captures market volatility. Other trusted indicators include the Investors Intelligence Sentiment Index, the Put/Call Ratio (a comparison of options betting on rises versus falls), and the NAAIM Exposure Index. Adding data from Commitment of Traders reports and tracking 52-week high/low numbers helps highlight market extremes.
- News-sentiment APIs that offer live tone analysis
- Surveys like AAII and Consumer Confidence for a clear view of investor mood
- VIX (a measure of how much prices swing during trading)
- Investor indicators such as the Investors Intelligence Sentiment Index, Put/Call Ratio (showing balance between bullish and bearish bets), and NAAIM Exposure Index
- Commitment of Traders reports and 52-week high/low metrics to pinpoint key market extremes
Final Words
In the action, sentiment trading strategies add a practical edge for digital investors. We took a close look at how market mood can influence decisions, built signals using clear data, and compared returns with benchmark results. The discussion also showed how mixing analysis with technical cues can improve signals and manage risk. This approach puts together solid insights and helpful techniques, pushing you to see market shifts as opportunities for smarter investments. Stay confident and curious as you build and refine your portfolio.
FAQ
What are sentiment trading strategies and what discussions appear on Reddit?
Sentiment trading strategies use investor mood data with technical signals to guide trades. Reddit communities share practical insights and tips, making these approaches accessible for both beginners and experienced traders.
What are market sentiment indicators and how do they reflect today’s market mood?
Market sentiment indicators, like the VIX and Put/Call Ratio, capture investor emotions by monitoring price swings and market activity. They help traders see if fear or optimism is dominating in real time.
What is the 90% rule in trading?
The 90% rule in trading suggests that most traders are typically wrong. This idea reminds traders to build strategies based on reliable data rather than following the majority blindly.
What is sentiment trading and how do traders profit from it?
Sentiment trading means using mood signals from investor behavior to time trades. Traders profit by aligning their decisions with prevailing market emotion, backed by technical data and steady risk controls.
What is statistically the most profitable trading strategy?
Profitability depends on many factors, but studies show that blending sentiment analysis with technical indicators and strict risk management often leads to more consistent returns than relying on a single method.
