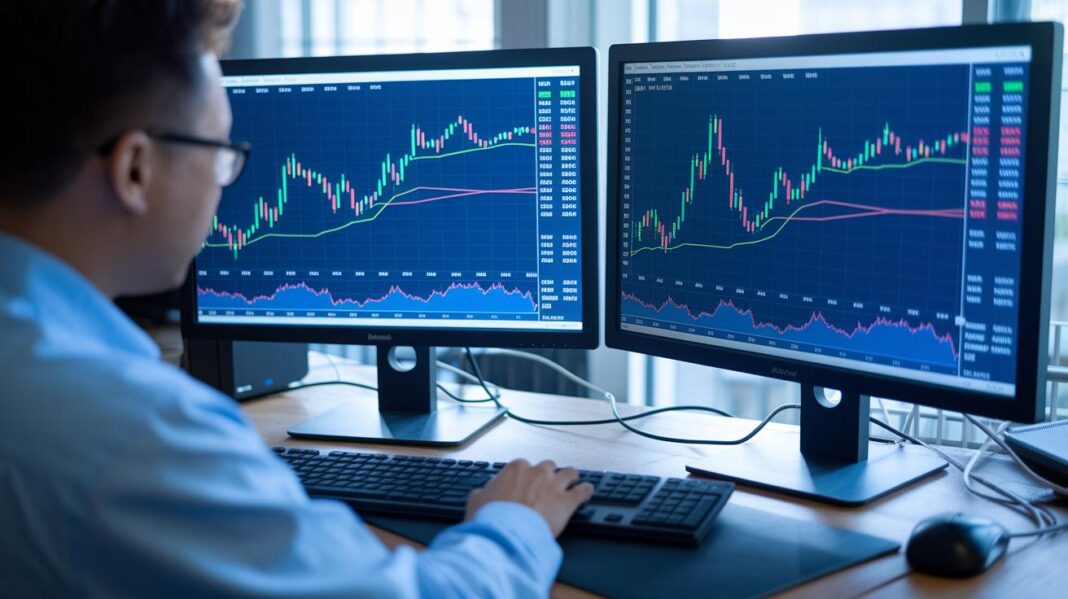
Ever wondered if one chart might unlock winning trades? Technical analysis (a method that looks at past market moves like prices, volume, and how much they change to predict future trends) shows us that these clues really do hint at what could happen next.
Take John, for example. He spent countless hours studying data until clear patterns emerged, and that shifted his whole strategy. By tuning into these market signals, traders can leave guessing behind and make decisions they feel good about. In short, reading these clues can give you the insight you need to boost your trading game.
Technical Analysis Overview for Traders

Technical analysis is all about reading price trends, volume, and volatility (that's just a fancy way of saying how quickly an asset's price moves) to test out trade ideas. Many seasoned traders use past data to check if their market theories need tweaking. For example, one might recall how John, before he became a well-known investor, spent countless hours studying charts to find patterns that others missed. This shows how spotting chart patterns can offer hints about where prices might go next.
Research has backed up the power of technical analysis, with studies showing steady profits until the early 1990s. In growing markets like Russia and India, traders have found that trends often stick around for one to 12 months before turning. And in the foreign exchange world, where company details are hard to come by, simple market signals become the go-to guide.
Using price-driven methods means traders rely on clear, observable data rather than abstract guesses. It’s a bit like noticing the steady rhythm of digital transactions, each price move fills in a piece of the bigger picture. This approach lets traders steer clear of guesswork, letting charts and signals decide when to jump in or pull out. By focusing on solid, evidence-based data, technical analysis helps build strategies that work well when market trends follow familiar patterns, making it an essential tool for many traders.
Chart Pattern Recognition Techniques in Technical Analysis for Traders

Chart pattern recognition is a key tool many traders use to read market charts and catch clear price signals. It means keeping an eye out for common shapes like head and shoulders, double tops or bottoms, and triangles. For example, a head and shoulders pattern might show a peak, then a higher peak, and finally a lower peak, suggesting a possible market turn. And here’s a fun fact: before becoming a world-renowned scientist, Marie Curie carried test tubes with radioactive material in her pockets, she had no idea of the dangers that would later shape her legacy!
Candlestick patterns add another layer to this method. These patterns show up as changes in the shapes on the chart and point out where prices might stop falling or rising, these are called support and resistance levels. Volume, or how many trades are happening, helps confirm if a move is strong enough to break these levels. For tips on how to draw trend lines and set these boundaries, check out this guide on how to conduct trend analysis: how to conduct trend analysis.
Putting together clear charts, marked support and resistance levels, and volume checks creates a reliable way to spot breakouts. These tactics help traders turn what they see into smart trading moves, much like reading the steady pulse of market activity and acting on it with confidence.
Momentum and Oscillator Indicators in Technical Analysis for Traders

Momentum indicators and oscillators are trusted tools that traders use to see if a market trend is strong or fading. Take the Relative Strength Index (RSI) for example, it measures from 0 to 100 and helps you figure out if an asset might be too expensive or too cheap. When RSI is above 70, it could mean prices have climbed too high, and when it’s below 30, it might suggest a price drop. One trader once shared that a timely RSI alert during a bull market helped him adjust his position and avoid a sudden reversal.
MACD, which means Moving Average Convergence Divergence, looks at the crossovers of moving averages to give hints about where the trend might go next. When the MACD line crosses the signal line, many traders take note because it can signal a new swing in market activity. This tool is especially useful during strong bull runs, providing clear and easy-to-read signals.
Another familiar tool is the stochastic oscillator. It shows where the asset’s closing price sits in relation to its trading range over a specific period. This comparison helps determine if buying or selling pressure is strong. Traders also watch out for times when the oscillator and the asset’s price tell different stories, a sign that extra attention is needed when deciding when to enter or exit a position.
Studies suggest that these tools work well when the market is rising steadily. Still, their effectiveness may drop during fast and high-frequency trading sessions. So, it’s important to mix these signals with a broader look at the market before making any moves.
Moving Averages and Trendline Strategies in Technical Analysis for Traders
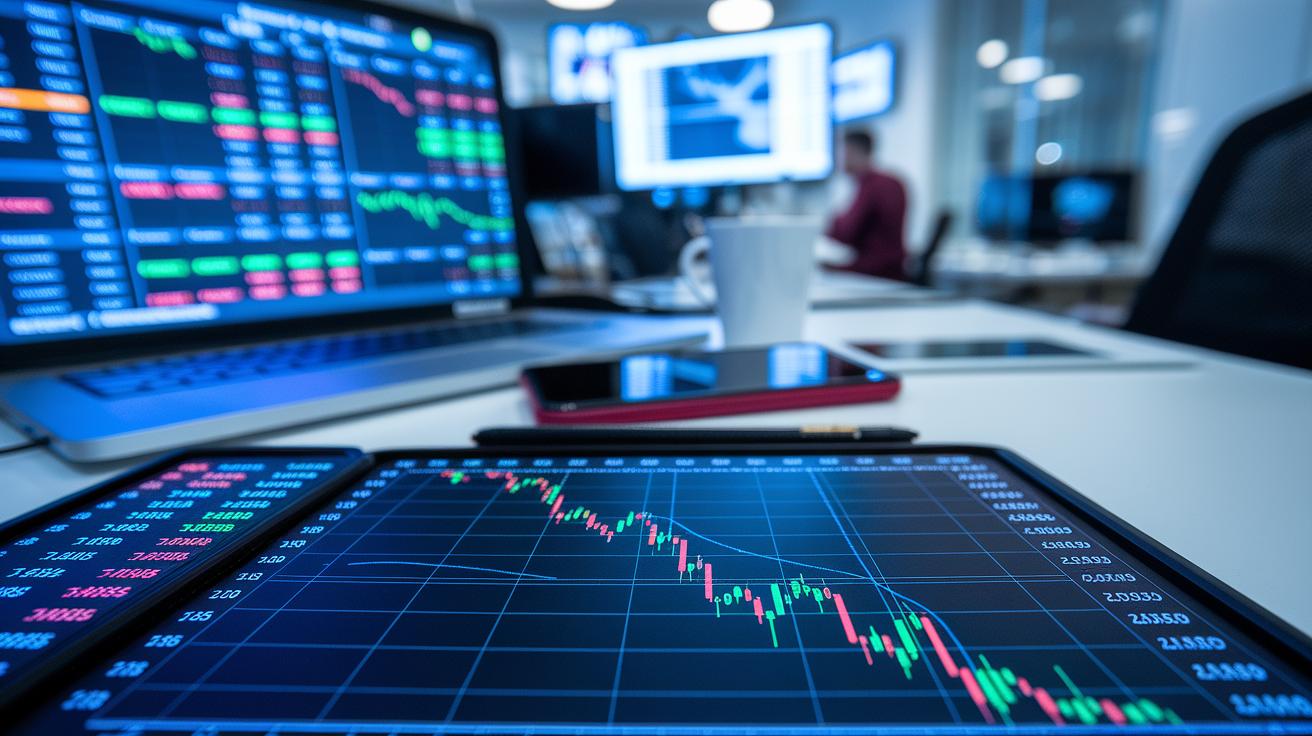
Simple and exponential moving averages help clear out the daily market clutter to show the real path of an asset. Think of your chart as a busy highway, these averages work like a long-exposure photo that captures the smooth, ongoing flow of traffic. In some emerging markets, using automated moving-average systems actually did better than just holding onto investments, which shows their power when trends are strong. If you want to dive deeper into reading market trends, check out this guide: analyze market trends.
Trendlines are drawn by connecting the highs or lows where prices swing and act as practical markers for support and resistance levels. Picture them like a staircase where every step represents a level that the price tends to respect. One trader once said, "I watched the trendline form like a clear pathway and adjusted my positions right as the market took a new step." This simple act of drawing accurate trendlines can really help you spot possible breakouts.
Fibonacci retracements add another useful tool by showing where prices might pull back before picking up again. Imagine a chart where prices drop to a key Fibonacci level, this can signal a fresh opportunity just when the market is gaining momentum. Many traders build breakout strategies by aligning their moving average, trendline, and Fibonacci level, allowing them to time their entries with real confidence.
- Use moving averages to smooth out volatility
- Draw clear trendlines to validate support and resistance
- Add Fibonacci retracements to spot potential pullback levels
When these methods line up, they give traders insights that match the natural rhythm of a strong market rally.
Developing Technical Analysis Trading Signals and Entry/Exit Strategies for Traders

Traders put together their signal systems by blending a few key ideas. They watch the market trend, check for strong support and resistance levels, use RSI (a tool that helps spot when an asset might be overbought or oversold) as a quick check, and confirm moves with volume analysis. One trader recalled how the RSI dropped below 30 while volume spiked, which felt like the market giving a friendly nudge to start a trade.
Using all these signals together helps cut out the noise and build a system that feels solid. In options trading, these clear cues help choose the right strike and expiration date so that every move stays on track. Traders also study price action and look for reversal signs, basically reading the chart’s story, to decide when to stay in or step away. Mixing these signals creates a more balanced risk and reward situation and helps avoid surprise turns.
- Follow the market trend and check strong support/resistance levels
- Use RSI to catch hints of overbuying or overselling
- Confirm with volume analysis to see if the move has real strength
- Combine price action insights with reversal patterns for better accuracy
Building clear rules for when to enter or exit a trade means knowing exactly when to jump in and when to pull out. One trader summed it up perfectly, saying that when all the signals agree, it’s like the market softly whispering, "Now’s the time," and that kind of clarity makes all the difference.
Risk Management Strategies in Technical Analysis for Traders

Risk management is a big deal when it comes to technical analysis. Traders work out how big their trades should be by matching the trade size with the gap between where they want to enter and their stop-loss level (a spot to exit if the trade goes badly). So, if a trader doesn’t want to risk too much of their account, they might choose a stop-loss that limits the loss to 2% or 5% of their money. Fees, slippage (when prices change fast), spreads, data charges, and taxes can sneak up on you too, so it’s important to watch real-world costs that could eat into your profits.
Balancing risk and reward is another clever trick. Many traders set a take-profit level that measures what they could earn against what they might lose. For example, if there’s a chance to make $100, they might set a stop-loss that risks only $50. This helps keep the risk-reward ratio in check and protects against overanalyzing too much data. Some methods even use clear price pointers that automatically close a trade if things start going downhill.
It helps to plan for extra costs that show up when the market shifts quickly. Little hiccups like tiny price moves and tax effects need to be part of your trading plan. Mixing technical analysis with digital finance risk management tools (tools that help keep your trades safe and smart) lets traders watch out for these hidden expenses and adjust their plans as needed.
| Tip | Description |
|---|---|
| Calculate position size | Match your trade size to the gap between entry and stop-loss. |
| Risk-reward evaluations | Set clear targets for both profit and loss. |
| Use stop-loss techniques | Automatically close trades if the market turns against you. |
| Account for execution costs | Keep an eye on fees, slippage, and taxes that can lower profits. |
These strategies help build a sturdy setup that stays ready, even when the market throws you a curve ball.
Essential Tools and Platforms for Technical Analysis for Traders

There are many charting tools available for traders. Some tools are free and easy to use online, while others are professional solutions that come with a cost. They feature handy drawing options, custom indicators, and live market charts that help you catch trends as they form. Many even include automated backtesting so you can quickly see if your ideas would have worked in the past by using historical data.
You can try interactive chart demos and free analytical tools before deciding on a full-featured platform. When you choose one, keep an eye on the quality of data, how much you can personalize the setup, and the overall price. Some platforms even let you share your insights with others or send alerts if a specific market change occurs. Mobile access is a great bonus too, making it easy to stay updated even when you're away from your desk.
Here’s a quick comparison of what to look for:
| Essential Feature | What It Means |
|---|---|
| Data Quality | Reliable, real-time market information |
| Customization | Options for drawing tools and custom indicators |
| Cost & Feedback | Affordable pricing and positive user reviews |
For more ideas on charting and visualization software, check out this link: https://gotocryptos.com?p=352
Final Words
In the action, traders explored the nuts and bolts of technical analysis for traders. We walked through chart pattern recognition, momentum guides, and trendline strategies, breaking down each part into clear, approachable steps. The discussion shed light on smart entry and exit signals while emphasizing risk management to protect investments. Every section showed how blending various tools can lead to a well-rounded approach. The journey encourages a balanced mindset, blending methodical techniques with a human touch for robust digital asset evaluation. Enjoy the ride ahead in your digital finance path!
FAQ
What is a technical analysis PDF and what does it include?
The technical analysis PDF provides a detailed guide covering chart patterns, trendline drawing, and oscillator usage. It serves as a solid reference for traders seeking step-by-step price action methods.
Which technical analysis methods are best for trading?
The best technical analysis for trading involves using trendlines, chart pattern recognition, and momentum indicator reviews. These methods help traders spot support and resistance and confirm trend strength effectively.
Are there free technical analysis resources available for traders?
Free technical analysis resources offer basic charting platforms, introductory guides, and sample tools covering price patterns and indicators. They are great for beginners wanting to test strategies without upfront costs.
What is an example of technical analysis in practice?
An example of technical analysis in practice is studying a price chart for head and shoulders patterns while noting oscillations on the RSI. This approach helps traders predict potential reversals efficiently.
Which technical analysis tools are used by traders?
The technical analysis tools used by traders include candlestick charting software, moving average systems, oscillators like MACD, and drawing tools for trendlines. These tools are essential for clear market analysis.
Is there a Forex trading technical analysis PDF available?
The Forex trading technical analysis PDF details methods such as plotting support and resistance, calculating moving averages, and applying momentum indicators. It is tailored to currency market nuances for clearer insights.
What does the 90% rule in trading mean?
The 90% rule in trading suggests that a majority of trades may yield small losses, highlighting the need for strict risk management. It helps traders set stop-loss levels to maintain a favorable gain-to-loss ratio.
How does one do technical analysis for trading?
Technical analysis for trading involves reviewing market charts, drawing trendlines, recognizing chart patterns, and validating signals with momentum indicators. This comprehensive method aids in timing entries and exits effectively.
Does technical analysis actually work in trading?
Technical analysis works by studying historical market data such as price and volume to forecast future moves. Although it isn’t perfect, many traders find it valuable for confirming and timing their trade decisions.
