
Ever wonder if that trading gut feeling is enough to keep you ahead? Our free technical analysis training shows you how to use charts to make smarter choices. In this course, you'll learn to spot key markers like support (the point where prices tend to stop falling) and resistance (the level where prices usually stop rising) and read candlestick patterns (simple pictures that show price changes) through hands-on exercises. Imagine these chart signals as road signs that tell you when to get in or out of a trade. With this training, you'll gain the basic tools to start trading with clear plans and a confident edge.
Getting Started with Technical Analysis Training: Core Charting Techniques

This free, hands-on 55-minute course introduces you to the basics of stock charting and price action. Whether you're new to trading or have some experience, you'll learn the must-know charting techniques that help you decide when to buy or sell. You'll see how to use support and resistance, simple markers that indicate good entry and exit points, and get a clear look at breakouts and fakeouts through practical examples. Ever notice how even seasoned traders rely on these visual cues?
In this course, you'll learn to set up for long and short trades by following trend lines and channels. The lessons break down candlestick patterns, making them as easy to understand as piecing together a puzzle. Plus, you'll explore moving averages, a tool that sorts out market trends and highlights opportunities during the steady pulse of market activity.
Interactive segments, including short lessons, quizzes, and real-life case studies, bring each concept to life. Each exercise encourages you to put theory into practice, so you not only spot patterns but also grasp how they shape your trading strategy. And of course, you'll get a gentle reminder that trading comes with risks, and losses can sometimes be more than your initial amount.
Focusing on clear, actionable steps and practical exercises, this beginner course gives you the skills you need to start your technical analysis journey with both confidence and clarity.
Chart Pattern Recognition in Technical Analysis Training

Step into the exciting world of chart patterns with our free lessons. In these sessions, you learn how to spot familiar shapes like head and shoulders (a pattern where a central peak is flanked by two lower ones), double tops and bottoms, triangles, and support/resistance zones. We break each pattern into two easy parts and include interactive drills so you get hands-on experience. Imagine seeing a head and shoulders formation on your chart; it acts as a hint to double-check your trade choices.
We also explore candlestick setups in detail. Using real-life examples, we show you how a specific candlestick can indicate a potential market reversal or continuation. These drills help you build a natural feel for reading charts accurately.
Every key term is explained in everyday language. For instance, you might want to visit our guide on what technical analysis in investment means. With practical exercises, you can spot patterns during live simulations, making the whole learning process both engaging and useful.
Through these pattern recognition workshops and chart drills, you build a solid foundation in technical analysis. This boosts your trading confidence as you start seeing the subtle cues in market movements. Experience how mastering charts can shape your trading strategy for the better.
Indicator Utilization for Technical Analysis Training

Moving averages are the bread and butter of many trading strategies. A simple moving average takes the average of price data over a set time and creates a smooth trend line to help you see which way the market is leaning. On the other hand, an exponential moving average gives more weight to recent prices, meaning it reacts quicker to changes, kinda like a fast alert when the market’s flow might shift.
Momentum indicators add another helpful layer. For example, the RSI (Relative Strength Index, which quickly checks if a price is too high or too low) labels conditions as overbought or oversold. And then there’s the MACD (Moving Average Convergence Divergence, a tool that acts like a market heartbeat) that helps spot turning points. Often, you might notice the RSI jump when a stock hits extreme levels, while crossings in the MACD lines serve as extra confirmation.
Combining these indicators can really sharpen your trading decisions. Suppose a moving average shows an uptrend and the RSI lets you know the asset isn’t overbought yet, this mix might signal a clear entry point. In short, blending these tools helps filter out the noise, giving you a solid foundation to base your trades on.
Technical Analysis Training: Fuel Your Trading Success

Trading is full of risks, so you always need to be careful. When you trade, you could lose more money than you start with. Think of it like getting ready for a bumpy ride where every move matters. Using stop-loss orders (which help limit losses if trades go wrong) and take-profit orders (which lock in gains when a goal is met) is like setting up safety nets for your trades. Did you know that some traders manage to keep their losses to just a few dollars by setting clear stop-loss levels? It’s a neat trick that turns a tough moment into a lesson learned.
Sticking to a simple, disciplined plan is key when the market goes up and down. Try these easy tips:
| Tip | Description |
|---|---|
| Position Sizing | Keep your trade size small enough so one loss won’t hurt you too much. |
| Risk-Reward Ratio | Measure if the potential gain is worth the risk you’re taking. |
| Trade Journaling | Write down your trades to review what worked and what didn’t. |
These steps make it easier to stay calm during market swings and help you build a solid trading plan. Each trade becomes a small step toward making smarter and more confident decisions.
Selecting Your Technical Analysis Certification Program

When you start building your trading skills, picking the right certification can be like choosing just the right tool from your kit. Imagine browsing through courses and finding one that fits your background, your goals, and even your interest in market trends.
For example, the Fundamentals of Technical Analysis from NYIF is a neat 10-hour course with no prerequisites. It’s meant for beginners, giving you a clear look at essential charting techniques and market patterns without feeling too heavy. Now, if you already know a bit about technical analysis, the Quantitative Technical Analysis course, also about 10 hours long, steps things up with more math and deeper analysis. It’s a great next step when you want to dive a little deeper.
If mixing coding with trading sparks your interest, the Machine Learning for Trading course might be your best bet. This course asks for a basic understanding of Python (a programming language used for many things, including data analysis) and statistics. It even teaches you to use Google Cloud to deploy AI signals, adding a modern twist to your trading approach.
For those who lean toward a more number-driven approach, the Practical Time Series Analysis course from SUNY uses R (a programming tool for statistics) to study sequential market data. With some background in intermediate statistics, this course shows you how to use visual models and math to capture the subtle rhythms of market activity.
Each program runs at its own pace and has its own angle, so it’s wise to compare your current skills with your trading dreams. Next, if you’re hungry for more details on quantitative methods, you might want to check out investment analysis techniques.
Real-World Case Studies in Technical Analysis Training
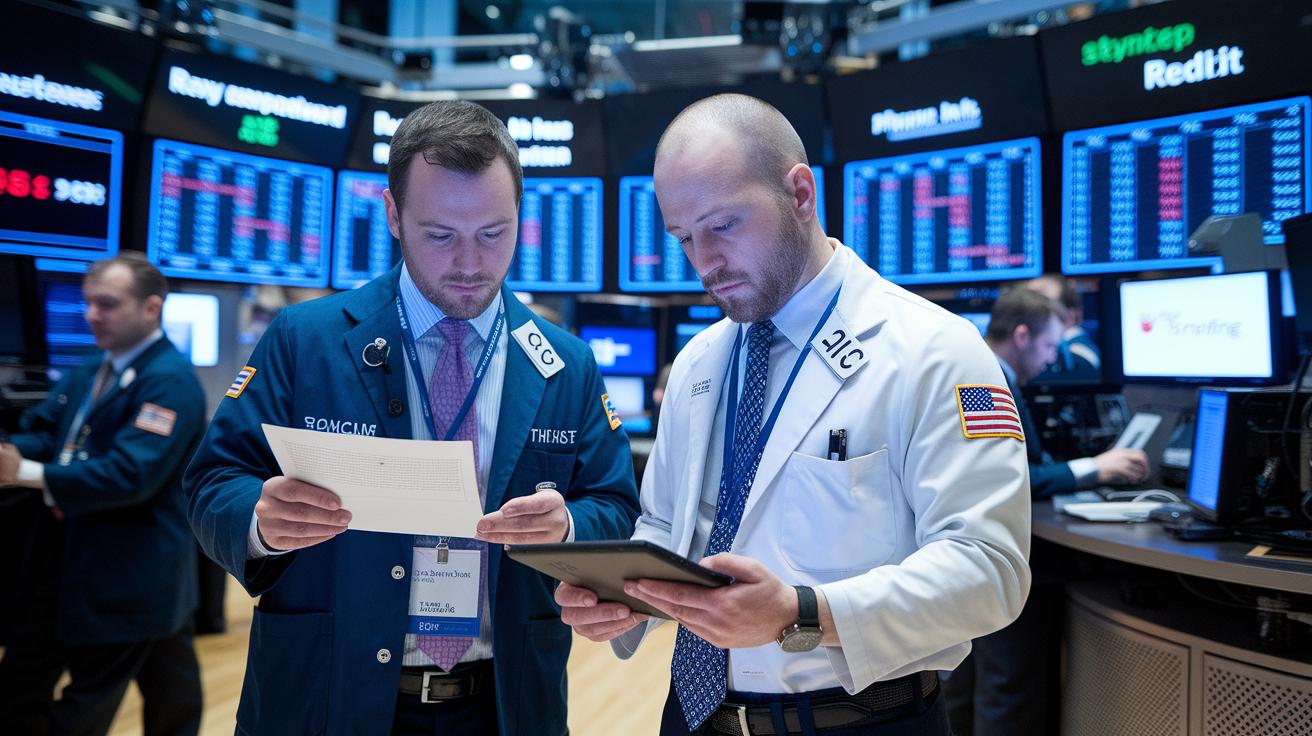
Step into lively market sessions where what you learn in theory comes to life. In these sessions, you'll explore detailed case studies that break down clear support and resistance trades (price levels acting like floors or ceilings for an asset), breakout strategies, and trend-following setups. Charts are carefully marked to show every step, from the exact moments to enter a trade to where to set stops to limit losses. One case even highlights a trade that began at an important support level, with the chart clearly pointing out a strong turnaround and careful stop-loss orders to protect against big losses.
Interactive exercises walk you through each chart, letting you practice analysis just like real trading decisions. Imagine joining a live session where a trader spots a breakout from a tight price channel. You’ll see exactly how to read small chart movements and tweak the trade as needed. These hands-on exercises really help drive the point home, giving you the feel of live market ups and downs.
Each case study shows how solid risk management and sticking to a plan can really make a difference. Live market reviews reveal how even tiny tweaks in your strategy can boost overall performance, underscoring that thoughtful planning is key to trading success. With every example, you'll clearly see how chart patterns link to real trade outcomes, driving your success with practical, real-world insight.
Advanced Technical Analysis Training Modules

Step into an automated, data-driven world with these advanced modules. You’ll learn how to design and polish your own trading strategies using modern techniques that feel as natural as a conversation. The training includes smart backtesting simulations that let you check your ideas against historical data, all before you put them to work live. Picture setting up a clever assistant that watches the markets for you, executing trades automatically.
Algorithmic Trading Module
In this part of the course, you get hands-on with creating trading algorithms using Python (a popular coding language) and broker APIs (tools that connect your code with your trading account). You’ll build backtesting frameworks, practical setups that show you how your strategies might have worked in past markets. Imagine crafting a strategy that finds the best times to enter and exit trades, then running a simulation to see it in action. It’s a dynamic workshop where you code, tweak, and fine-tune your algorithms to keep up with shifting market conditions.
Statistical Time Series Module
Here, you’ll explore sequential price data using R (a tool for statistical analysis) and learn to apply simple statistical models. You’ll create clear, visual charts that help you spot trends, almost like reading a story told by market numbers. By choosing the right forecasting model, you can test your predictions and boost your chances of trading success. In virtual lab sessions, you simulate real trading scenes, practicing model selection and forecast validation in a safe, risk-free setting. This module gives you a deeper, numbers-driven insight into technical analysis that sharpens your overall trading strategy.
Final Words
In the action, the blog post walked through a step-by-step breakdown of technical analysis training. It covered essential charting techniques, chart pattern recognition, and market indicator use, while also reviewing risk management tactics. Certification options were compared alongside real-world case studies and advanced modules like algorithmic trading and statistical analysis. This practical look into technical analysis training leaves you ready to build a stronger, smart digital asset portfolio.
FAQ
What free online technical analysis courses are available?
The technical analysis training online free query indicates many platforms now offer free beginner courses, including PDF materials and certification options. These courses cover chart patterns, technical indicators, and risk management practices.
What is the best technical analysis course?
The best technical analysis course discussion means that quality depends on your learning style. Look for courses with interactive lessons, real-life case studies, and hands-on drills to build robust market analysis skills.
What is the best way to learn technical analysis?
The best way to learn technical analysis usually involves structured online training that melds core charting techniques with practical exercises and live examples, making it easier to grasp market trends and refine your strategy.
What are the 4 pillars of technical analysis?
The discussion about the 4 pillars of technical analysis generally includes trend recognition, chart patterns, technical indicators such as moving averages, and risk management strategies that guide informed trading decisions.
Does JP Morgan use technical analysis?
The inquiry into whether JP Morgan uses technical analysis shows that while the firm primarily focuses on fundamentals, it may incorporate technical insights to better time trades and support broader investment strategies.
