
Have you ever wondered how investors' feelings can steer the economy? Just think back to the stock crash in 1929 or the market shock of 2008.
These moments remind us that market sentiment is more than just numbers. It shows the way people feel and decide. We see patterns where fear and hope push markets up and down.
By looking at past trends, we get hints to understand today’s shifts and learn to read the market moods that truly matter.
Historical Market Sentiment Case Studies: Inspiring Trends

This section pulls together different case studies, from the crash of 1929 to the meltdown of 2008 and the LTCM collapse in 1998, to show how market moods have shifted over time. By looking at data over many years, we see clear cycles where fear and excitement push markets up and down. For instance, old tools like broker surveys and counting headline increases help us understand when panic or optimism took hold.
The discussion also looks at how big moves by the government can calm things down. One example is the creation of the Plunge Protection Team in 1988, which was designed to ease worries before they could cause bigger problems. Other factors, such as negative arbitrage pressures and greenmail, also played a part in stirring up market reactions. Even small issues in one area often spread and affect markets everywhere.
Topping the analysis are expert insights and easy-to-read charts. Throughout, you’ll find straightforward explanations backed by numbers that track how investors behaved during turbulent times. Key indicators like equity volatility (how much stock prices bounce around) and credit spread changes (variations in the cost of borrowing) are discussed to show us what happens when markets hit rough patches.
In short, looking back at these market moods helps us spot patterns. Not only does this explain what happened in the past, it also gives us clues to read today’s financial scenes. Fun fact: during the 1929 crash, margin-call cycles led to an 85% drop in stock values over three years, showing just how much investor sentiment can intensify a market spiral.
Historical Market Sentiment Case Study: 1929 Stock Market Crash

Late in 1929, newspapers stirred up serious panic with dramatic headlines. The sensational news turned cautious optimism into a rush of sell-offs, and margin call cycles (when brokers demand extra funds to cover losses) only made things worse, pushing stock values down by 85% over three years.
Early on, broker surveys, simple tools where brokers shared their gut feelings, picked up on these shifts in sentiment. In one surprising example, a single bold headline was enough to trigger a wave of margin calls, making traders feel like the market was falling apart right before their eyes.
It’s clear that the media played a big role in deepening the crisis. Constant, stark reports made investors even more nervous, with small-town brokers later recalling how every alarming news story added to the sense of a real-life financial drama.
At the time, public policy was just starting to find its footing. The temporary measures then hinted at a need for more structured oversight to calm the market, a far cry from the robust safeguards we trust today.
Historical Market Sentiment Case Study: 1987 Black Monday Crash
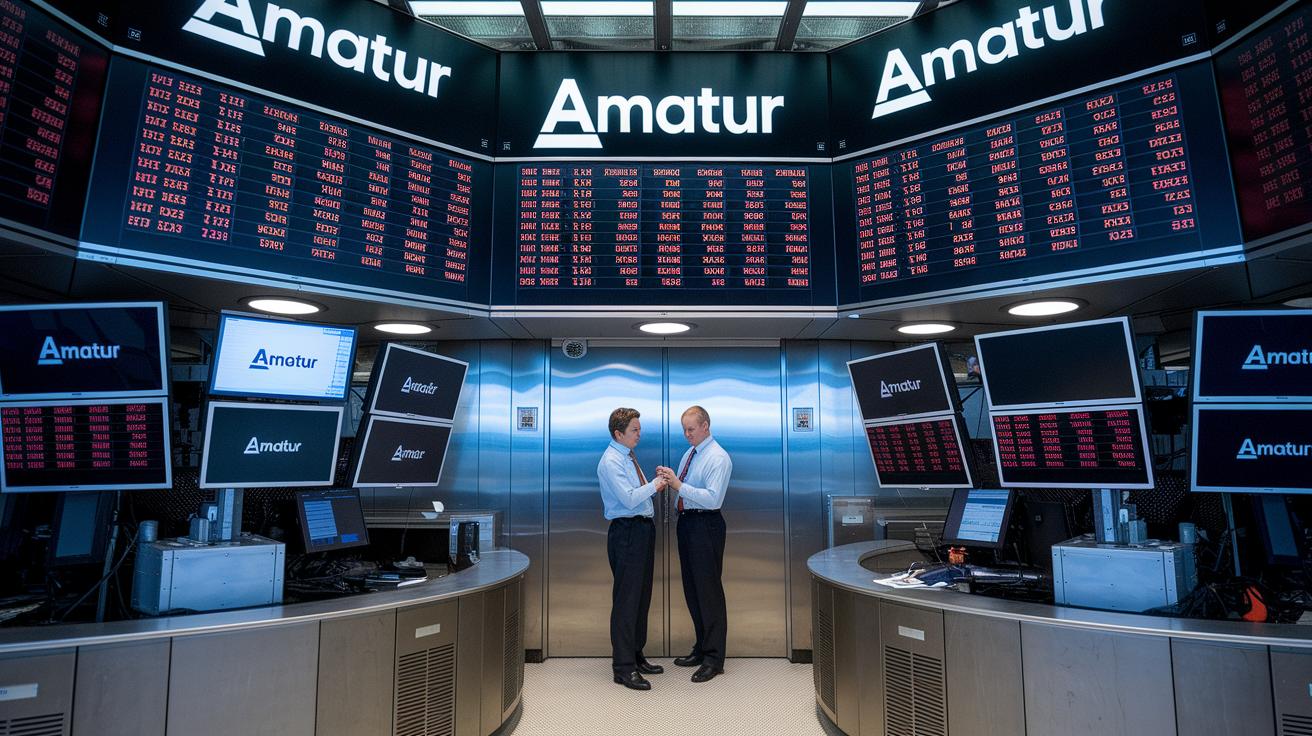
October 19, 1987, was a wild day for markets around the world. On that day, traders saw numbers drop rapidly, and the movement felt even more extreme than usual. The drop was so intense that every tiny change on the stock screen seemed to shout fear, making the Dow record its biggest one-day percentage fall ever.
Right from the start, signs of a changing mood were clear. Traders quickly moved from cautious hope to outright worry. Imagine staring at a trading screen as numbers tumble in just seconds, investors felt like everything was careening out of control.
It wasn’t just a U.S. problem either. Markets everywhere started to mirror the downturn, showing that global trading systems can be quite tied together. Later, measures were set up to help calm things down, including what became known as the Plunge Protection Team in 1988. These steps were meant to steady traders and ease the panic that had gripped the market.
In short, the 1987 crash taught us a lot. It showed that quick shifts in mood, mixed with technical pressures, can lead to major market reactions, a lesson that still shapes how many investors think about and manage risk.
Historical Market Sentiment Case Study: 2008 Financial Crisis

Between 2007 and 2009, borrowing costs (credit spreads) started to climb, sending a clear message that investors were getting nervous. As debt-to-GDP ratios and default rates edged upward, confidence gave way to caution. Money managers and bank leaders began pulling back from risky bets in the midst of mounting uncertainty.
Imagine watching a thermometer steadily rise on a chilly day. When default numbers began to hit higher levels, market players sharply reduced their leverage, which only added to the sell-off. This shift in behavior pushed markets into deeper instability, and central banks stepped in with monetary adjustments to try to ease the panic and unpredictable swings.
The data from that period shows how quickly investor attitudes shifted from bold expansion to defensive playing it safe. Every move made across financial instruments highlighted just how tied market mood was to credit conditions. For a closer look at these changes, check out the market crash 2008 report.
Historical Market Sentiment Case Study: 1998 Contagion and LTCM Collapse

Back in 1998, a local credit crisis sparked fears that quickly spread around the globe. The Russian default combined with the collapse of Long-Term Capital Management made markets tremble. Data from that time shows that credit spreads widened and stock prices became very unstable. It felt almost as if everyone woke up to a market that was on edge.
Early signs played a key role in capturing this shift in mood. Analysts kept an eye on indicators like the truck tonnage index (which measures commercial activity by tracking how many trucks are on the road) and looked at how negative sentiment jumped from one market to another. These signals made it clear that when one sector stumbled, it could trigger a domino effect across the board.
The numbers told the story. The truck tonnage index, a trusted gauge of economic momentum, revealed a slowdown in commercial movement. This simple measure not only highlighted the onset of credit stress but also showed how panic spread from one part of the market to another.
In short, this case study reminds us that even a small financial hiccup can lead to widespread uncertainty and volatility. Markets are closely linked, and an issue in one corner can quickly impact many others.
Sentiment Analysis Methodology in Historical Market Sentiment Case Studies

When we look back at past market moods, analysts need clear signals they can measure. They put together lots of data points, almost like piecing together a puzzle of investor feelings. In the early days, they relied on things like media headline indexes and volatility measures (which tell you how fast prices change) to get a sense of the mood. Today, experts use refined versions of these methods to help figure out if a market crash might be on the way. For example, check out "is a stock market crash coming" on ontheblockchains.com.
Experts dig deep into old data by comparing closing price trends with credit spreads (the gap between different interest rates) and default-rate series (which show how often borrowers miss payments). These methods help make sense of those hard-to-measure market feelings. Often, you'll hear experts talk about the tug-of-war between cold, hard numbers and the softer signals of sentiment that only appear with careful study.
Common historical sentiment indicators include:
- Newspaper headline counts
- Leveraged fund flow data
- Volatility-index levels
- Credit-spread measures
- Auction price anomalies
| Indicator | Data Source | Interpretation |
|---|---|---|
| Newspaper headline counts | Media archives | Shows how strong public emotion is |
| Volatility-index levels | Market data feeds | Gives a sense of market uncertainty |
In short, these methods blend clear number work with expert insight to chart long-term shifts in market moods and trends.
Lessons from Historical Market Sentiment Case Studies

Looking back at past market moods, it’s clear that how people feel can really sway market actions. When investors get excited or nervous, it creates cycles that push markets up or pull them down. Case studies from the past show that warning signs, like a spike in negative news or sudden changes in trading, often come before significant market moves. When fear starts to build, even a small hiccup can trigger a big drop, while positive policy moves can help the market regain its balance.
Smart investors can learn a few key things from history:
- Notice early hints such as quick shifts in price wiggles or credit spreads (the difference in interest rates) to predict tougher times.
- Keep in mind that small shifts in mood can snowball into bigger market swings.
- Watch for actions by policymakers, as these can serve as safety nets during turbulent times.
If we peek at events like the 1929 Crash, the 1987 Crash, and the 2008 Crisis, they all remind us that history gives helpful clues about what might happen next.
| Case Study | Main Sentiment Driver | Outcome |
|---|---|---|
| 1929 Crash | Pervasive fear and margin-call cycles | Extreme equity decline over three years |
| 1987 Crash | Rapid mood shifts and volatility spikes | Largest single-day percentage drop in Dow history |
| 2008 Crisis | Risk aversion amid widening credit spreads | Global financial meltdown |
In short, even simple measures of market sentiment can be powerful tools for managing risk and spotting opportunities as market moods change.
Final Words
In the action, the article laid out concrete insights through historical market sentiment case studies. It traced the mood swings during events like the 1929 stock market crash, Black Monday, and even the 2008 crisis, highlighting how early signals can shape outcomes. Readers saw clear data sources and relatable examples, making market patterns much easier to grasp. Each segment reinforced that smart, data-backed strategies can empower your digital asset portfolio. The future looks bright when past market moods guide the next move.
FAQ
What do historical market sentiment case studies PDFs and examples show?
Historical market sentiment case studies in PDFs provide snapshots of investor moods during key market events. They use data like media headlines and surveys to reveal patterns seen during events such as the 1929 crash and 2008 crisis.
How do market sentiment websites, trackers, live tools, and apps help analyze investor mood?
Market sentiment platforms offer real-time views and historical data on investor behavior. They provide interactive charts and simple tools that help you spot trends and potential market shifts quickly.
What does stock sentiment analysis involve?
Stock sentiment analysis looks at investor behavior by examining news headlines, trading volumes, and related data. This analysis helps point out short-term market trends and can guide more informed investment decisions.
How does social sentiment affect stocks?
Social sentiment for stocks tracks online discussions and social media activity to capture investor feelings. This insight can highlight shifts in public opinion that may influence stock prices and overall market dynamics.
