
Ever wonder how traders almost seem to predict crypto price jumps? They look at simple charts and price markers, a method known as technical analysis (basically, reading past price trends to guess future moves). It turns old price data into clues that make the market seem less wild. By keeping an eye on these clear trends, both newbies and seasoned traders can plan smart moves and spot when prices might change.
Understanding Crypto Market Trends with Technical Analysis
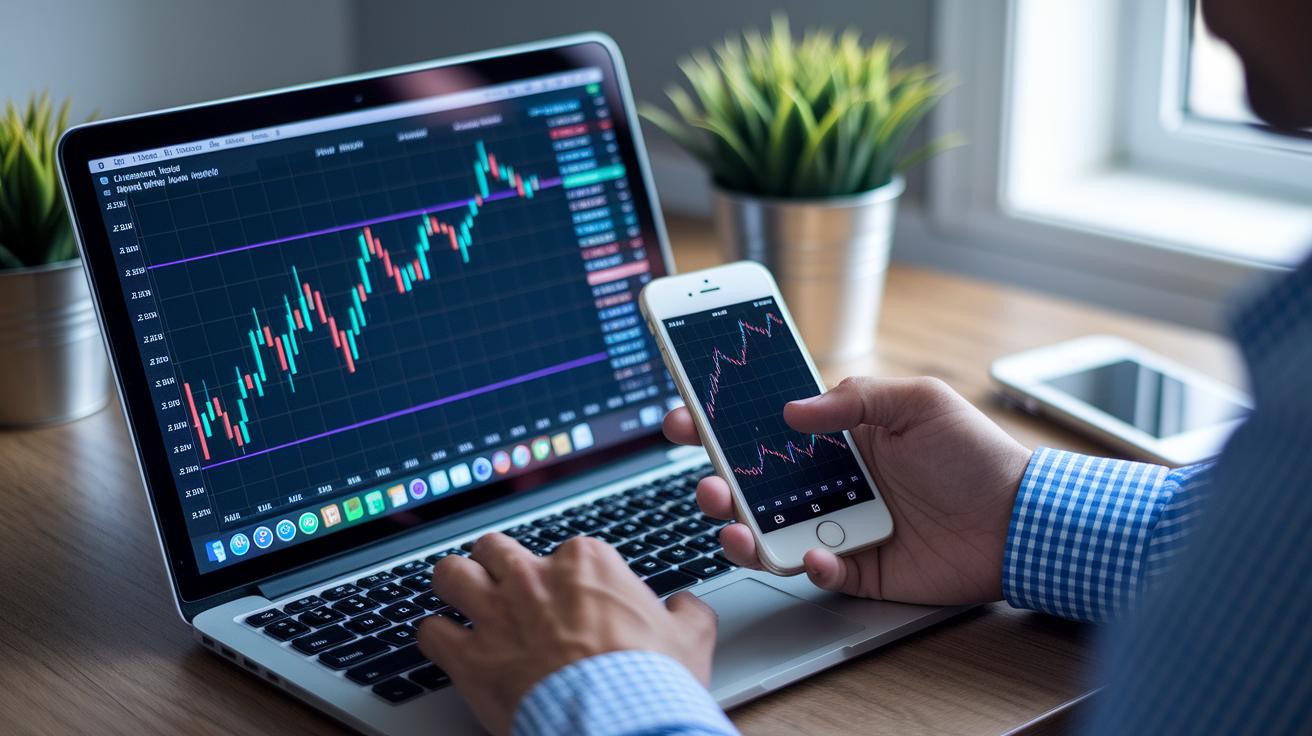
Technical analysis on cryptocurrency looks at past prices using simple tools like support and resistance lines, trend lines, and candlestick charts. Before finding success in the digital market, early bitcoin traders relied solely on simple sketches of price movements to make decisions. This hands-on method lets traders make sense of sudden price jumps and drops.
When you study crypto trend analysis, you see the steady flow of digital transactions and feel the overall market mood. For example, candlestick analysis shows clear price points for short periods, telling you when the market might change direction. Bitcoin technical analysis and Ethereum technical analysis often use the same chart techniques, even though each coin can have its own little quirks.
Technical analysis also means checking if the market is overbought or oversold. This is done by watching changes in volatility and momentum that hint at a slowdown or an upcoming burst in price. Drawing support and resistance lines carefully can show where prices might bounce back or break through, helping investors plan their next steps.
| Tool | Purpose |
|---|---|
| Support/Resistance Lines | Spot key price levels where trends might change |
| Trend Lines | Outline the general direction of prices and possible breakouts |
| Candlestick Analysis | Display price patterns to help time buying and selling |
These chart-based methods create a clear view of market trends and help manage risk. By finding common patterns, technical analysis turns a complex market into one that feels more predictable, so traders can act with more confidence.
Identifying and Trading Cryptocurrency Chart Patterns

Chart analysis in crypto is like peeking into a clear picture of price movements. Patterns such as head and shoulders, double tops and bottoms, triangles, flags, and wedges give traders a helpful heads-up about potential shifts in trends. For example, a head and shoulders pattern can be a sign that the market might soon change direction, it’s almost like nature hinting at what’s coming next.
Traders mark past highs and lows to draw these patterns and then keep an eye on volume spikes. A sudden jump in volume, much like the subtle hum of digital transactions, confirms that a breakout or a breakdown might be underway. This gives a much clearer signal that the market is really gearing up for a move.
| Chart Pattern | What It Might Signal |
|---|---|
| Head and Shoulders | A potential reversal in trend |
| Double Tops and Bottoms | A struggle in pushing a trend further |
| Triangles | A consolidation phase before a strong breakout |
| Flags and Wedges | A pause that might lead to resumed or slowed momentum |
Traders often confirm these setups with additional tools like moving averages, which smooth out the details and help spotlight trend shifts. It’s like pairing a reliable map with a trusty compass, each tool brings a bit more clarity so you can decide the best moment to jump in or step back.
In short, turning visual patterns into clear trading actions is all about spotting the right signals and confirming them with extra evidence. This steady approach helps investors feel more secure and confident as they navigate the lively world of crypto trading.
Key Technical Indicators for Crypto Market Analysis
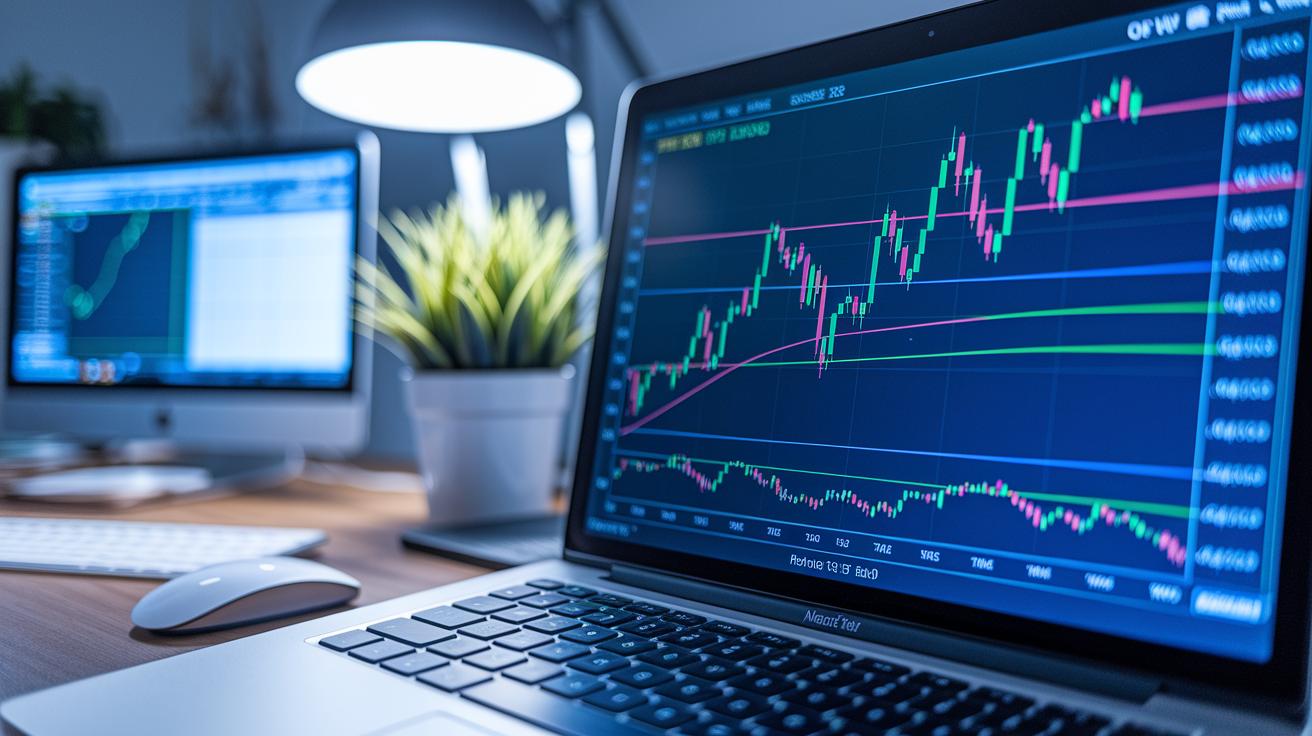
Technical analysis helps crypto traders see the market’s trends and shifts in momentum clearly. One common tool is the Relative Strength Index (RSI), which scores between 0 and 100. If the RSI is over 70, it usually means the market might be too high (overbought), and if it’s under 30, the market might be too low (oversold). It’s interesting how even a small change in the RSI can really change how traders feel and act.
Another favored tool is the MACD. This stands for Moving Average Convergence Divergence, which might sound tricky but is simple once you break it down. It takes the difference between two averages (one from 12 days and one from 26 days) to show how strong or weak the price move is. Think of it like watching a sports team, when you notice a shift in performance mid-game, you know something is about to change.
The On-Balance Volume, or OBV, looks at how much trading happens by adding or subtracting volume based on price moves. When the volume and price start to disagree, it can signal something important is on the way. Similarly, the Awesome Oscillator compares two simple moving averages (5-period and 34-period) of the middle price, giving a feel for shifts in energy among buyers and sellers. It’s like catching a change in the buzz of a busy marketplace.
Fibonacci Pivot Points use specific ratios (0.618 and 1.272) from past high, low, and close prices to help predict where the price might hit support or face resistance. Then there’s the Parabolic SAR, which puts dots above or below the price. These dots act a bit like beacons, showing the trend direction and even helping set stop-loss orders to manage risks. Getting to know these tools can really boost your approach to crypto market analysis, offering a balanced look at potential trends and shifts.
Applying Moving Averages and Oscillators in Crypto Analysis
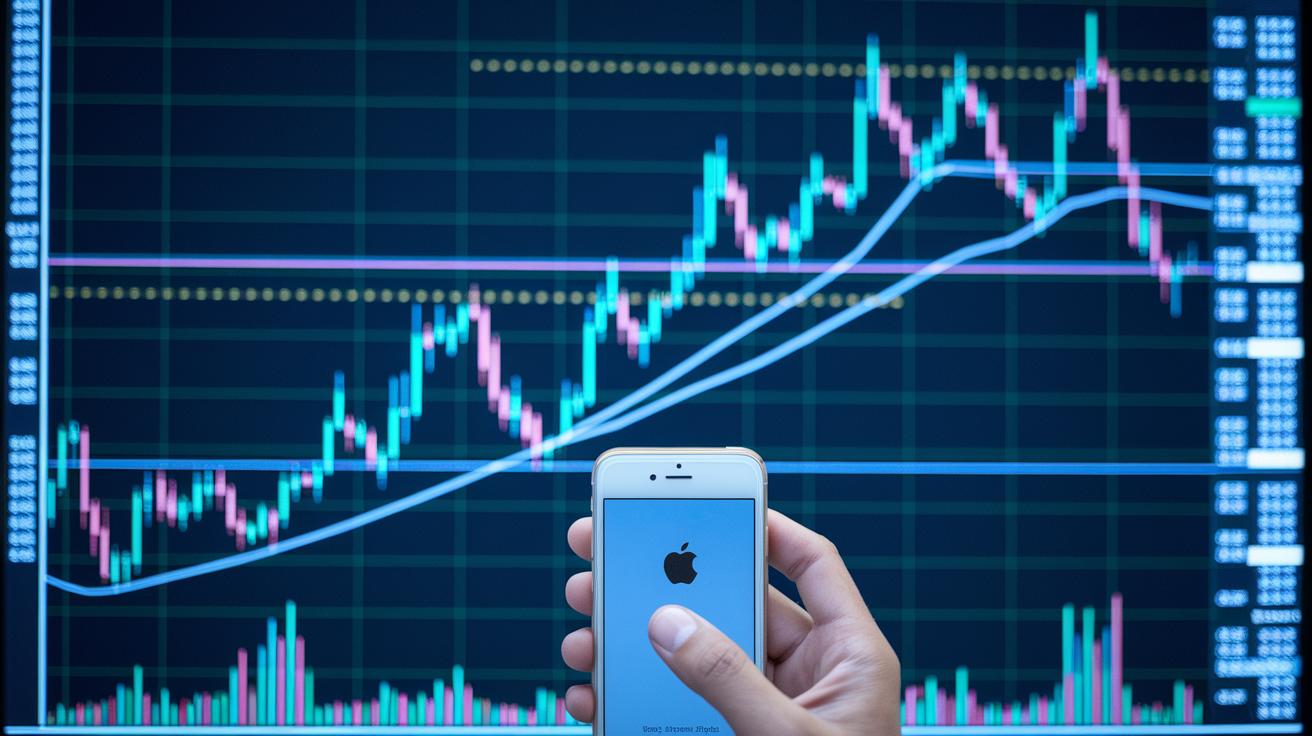
One cool tactic sets up custom alerts that kick in when both a golden cross and a sudden burst of momentum pop up at the same time. For example, imagine a trader who gets notified when the 50-day simple moving average (SMA), a measure of recent price trends, crosses above the 200-day SMA, and right then the Awesome Oscillator (a quick look at market momentum) jumps into positive territory. Surprisingly, in one case, the alert went off five days before the expected crossover, giving the trader a head start into a bullish market.
Real-life examples show that mixing these tools helps clear up market signals, especially when things move fast. One trader used real-time moving average updates to notice a rising surge of momentum. The moment the oscillator signaled strong buying activity, he confirmed the trend using trend lines drawn at swing highs and lows, spotting key support levels that reinforced the moving average signal.
Some strategies use preset rules to keep an eye on both moving averages and oscillators at once. For example, you might set rules like this:
| Strategy | Description | Confirmation Level |
|---|---|---|
| Early Entry | An alert kicks in when the oscillator jumps up before the full crossover is confirmed | High momentum signal |
| Layered Confirmation | Merges the moving average crossover with trend line checks at swing highs and lows | Multiple signals align |
Adding trend line checks provides another smart layer. Custom alerts can watch for bounces off drawn trend lines, and when that lines up with signals from the oscillator as well as a moving average crossover, traders get a full picture of the market timing.
Formulating Technical Trading Strategies for Cryptocurrency
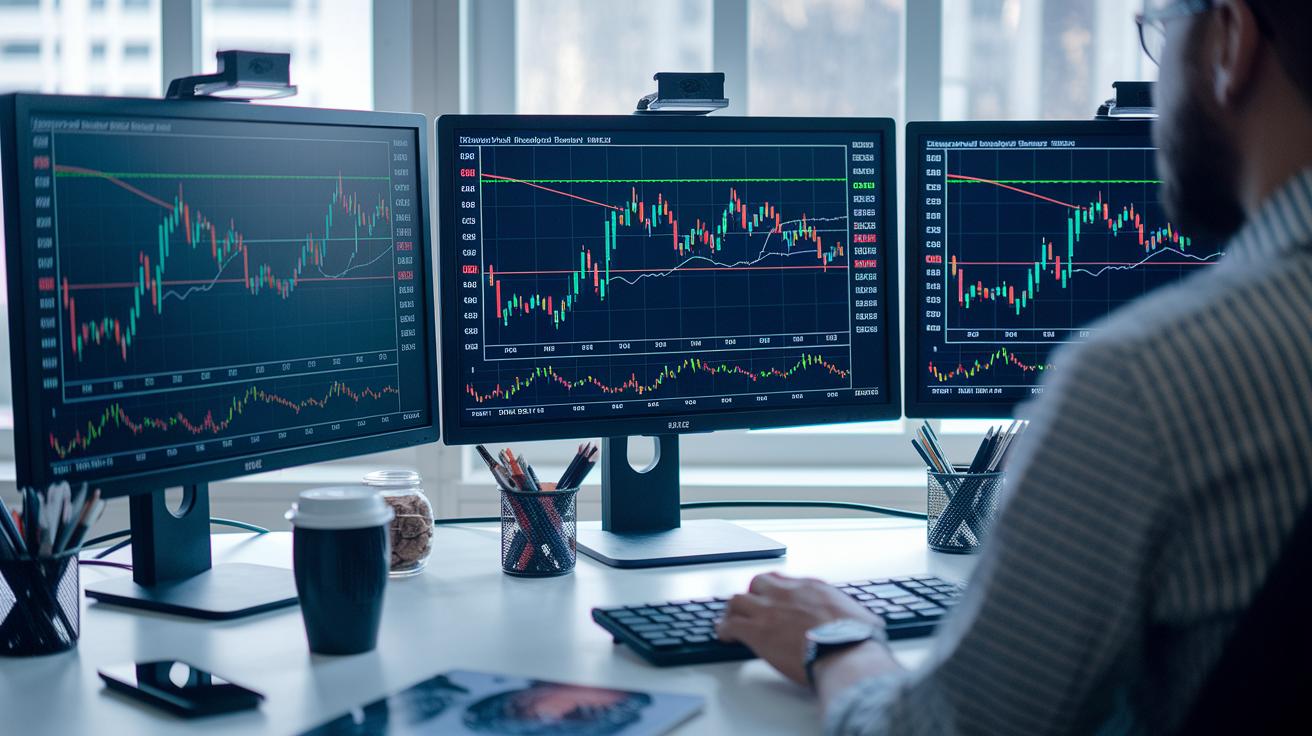
When you study crypto charts, it builds excitement by showing you a hands-on way to plan your trades even when prices bounce around. Clear chart patterns act like a roadmap in a busy city of numbers. One trader once saw a 50-day moving average cross above a 200-day moving average, along with drawn trend lines confirming the direction, and suddenly a wave of buy orders surged the market higher.
Breakout plays work in a similar way. Imagine a price breaking out of a shape like a triangle or a flag, paired with a noticeable jump in volume – which shows more traders are joining in. I remember seeing a burst in volume break the market free from a tight consolidation, sparking immediate buying activity.
Mean-reversion methods are another clever tactic. They use the RSI (Relative Strength Index, which measures if an asset might be too cheap or too expensive) that swings around levels like 30 and 70. When the RSI dips below 30, it hints that prices might bounce back, while a reading above 70 could signal a drop ahead. And if you’re into quick wins, scalping strategies that watch short-term moving averages and candlestick patterns can capture small, fast gains during the day.
Managing risk is key. Many traders use stop-loss orders and take-profit points linked to indicators like Parabolic SAR dots (which signal potential price moves) or Fibonacci pivot zones (based on natural number patterns). Here’s a simple plan to consider:
- Spot the trend using moving average crossovers.
- Confirm the trend with drawn trend lines and volume analysis.
- Keep an eye on RSI readings for those mean-reversion signals.
- Use scalping strategies on short-term charts when candlestick patterns look clear.
- Place your stop-loss orders near these indicator points to control risk.
Before you jump into live trades, backtesting these strategies on historical data can be a smart move. Trying out paper trading helps turn these raw market signals into a clear and measured approach. In short, combining careful chart analysis with a personal, hands-on strategy might just help you navigate the ever-changing crypto market with confidence.
Risk Management Techniques in Crypto Technical Analysis

Managing risk in crypto trading is crucial to protect your trades from unexpected market moves. Tools like the Parabolic SAR help you set stop-loss orders just a bit beyond key turning points, giving you early signs to step away if needed.
Charts often highlight support and resistance levels using methods like Fibonacci pivots along with swing highs and lows. These markers let you know when it might be time to exit a trade. By adjusting position sizes based on measures like ATR (which shows how much prices typically move) or Bollinger Band width (indicating the degree of price fluctuation), you can aim for a risk-reward setup of at least 1:2, keeping your capital safer during wild swings.
It’s also smart to keep an eye on momentum shifts. Indicators such as RSI (which tells you the speed and change of prices) or the AO (that compares recent market momentum) can offer timely alerts to exit before the market turns against you.
Some traders also use a method called fixed fractional risk to tweak trade sizes based on market conditions, cutting down on exposure and protecting the overall portfolio.
- Using Parabolic SAR for setting stop-loss orders
- Identifying support and resistance through Fibonacci pivots and swing highs/lows
- Adjusting positions with ATR and Bollinger Band width
- Watching momentum using RSI and AO for early signals
- Employing fixed fractional risk to manage portfolio size
Essential Tools and Platforms for Real-Time Crypto Technical Analysis
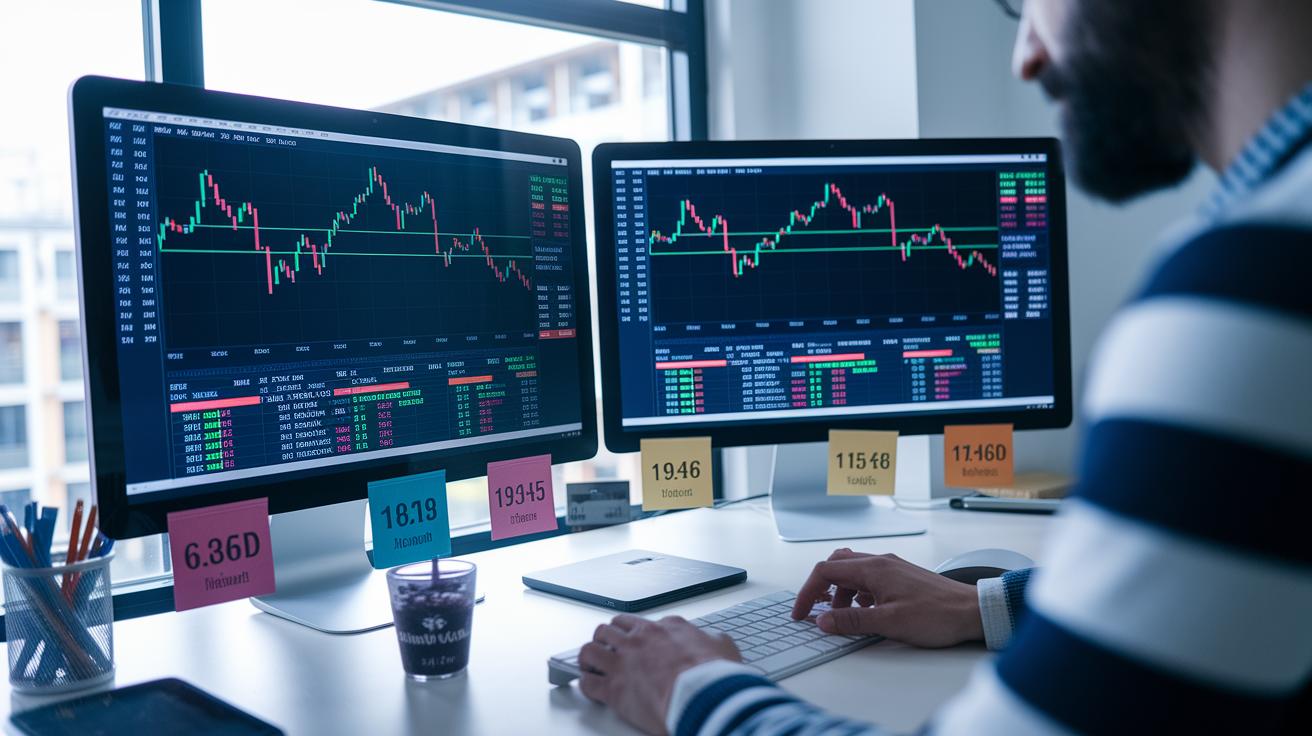
Using top charting sites can change the way you see market trends. TradingView has a bunch of tools like custom scripts and live data feeds (live information that updates in real time), which keeps you in the know every minute. Imagine getting a sudden alert when a key moving average crossover occurs, similar to a doorbell ringing to announce your next big opportunity. This kind of instant alert system boosts your confidence and helps you decide fast.
Coinigy lets you view data from multiple exchanges all in one place. It provides real-time alerts that let you catch quick shifts in momentum across different tokens. Then there’s CryptoCompare, perfect for those who like a simple setup. It offers live watchlists and basic drawing tools (simple features to mark trends on your chart) without overwhelming you with too many details.
For beginners, free crypto chart software is a great start. You get easy-to-use drawing features, preset indicators, and simple alerts that guide you through the setup. Plus, mobile crypto trading apps pack these features into a handy format so you can check your charts and tailor your watchlists anytime, anywhere.
| Platform | Features |
|---|---|
| TradingView | Extensive toolset, scripting, live data feeds |
| Coinigy | Multi-exchange integration, real-time alerts |
| CryptoCompare | Live watchlists, basic drawing tools |
In short, real-time crypto charts empower you to spot every market move and act swiftly as conditions change.
Final Words
In the action, our guide explored the use of technical analysis on cryptocurrency to study chart patterns, indicators, and moving averages. We broke down how trend lines, breakout signals, and risk controls work together to set clear entry and exit points. The discussion showed how simple tools can help shape a sturdy trading plan while protecting your investments. This insight leaves you with practical steps to build and secure a digital asset portfolio. Keep enjoying the pulse of the market and make each move count.
FAQ
Q: What does “technical analysis on cryptocurrency pdf” mean?
A: The phrase “technical analysis on cryptocurrency pdf” refers to downloadable documents that explain chart patterns, support/resistance levels, and indicator use to help traders interpret crypto market trends effectively.
Q: What are free technical analysis resources and courses for cryptocurrency?
A: The inquiry about free technical analysis resources highlights no-cost guides, tutorials, and courses available online that teach chart patterns, trendlines, and indicators, offering beginners a solid introduction to crypto trading.
Q: What does crypto technical analysis for beginners involve?
A: The question on crypto technical analysis for beginners points to learning basic chart reading skills, such as understanding support/resistance, trendlines, and simple indicators, with many interactive tools and tutorials available online.
Q: Which websites and apps offer crypto technical analysis?
A: The query seeks platforms providing technical analysis tools. Websites like TradingView deliver detailed charting features, and mobile apps offer real-time data, customizable indicators, and alerts for on-the-go crypto market updates.
Q: What does “Bitcoin technical analysis today” indicate?
A: The term “Bitcoin technical analysis today” asks for current chart reviews of Bitcoin, using up-to-date candlestick patterns, moving averages, and other indicators to spot momentum and market trends in real time.
Q: Which indicators are top choices for crypto trading and buy/sell decisions?
A: The focus on top indicators addresses tools like RSI, MACD, OBV, Moving Averages, and Fibonacci Pivot Points. These indicators help assess momentum and overbought or oversold conditions to guide buy and sell signals.
Q: Which technical analysis method is best suited for cryptocurrency?
A: The question asks which analysis approach works best. Many traders combine moving averages, oscillators, and chart patterns to capture trend reversals and momentum shifts in the fast-moving crypto market.
Q: What does the “30 day rule” in crypto refer to?
A: The “30 day rule” usually denotes a recommended timeframe for evaluating price trends or holding periods in crypto analysis, though its exact definition can vary by trading platform or strategy.
Q: Can ChatGPT analyze crypto charts?
A: The query explores ChatGPT’s capabilities. While ChatGPT can explain chart concepts and technical analysis theories, it cannot directly access or assess live crypto chart data for analysis.
Q: What are crypto fundamentals?
A: The term “crypto fundamentals” refers to the core factors behind a digital asset, including blockchain technology, use cases, market supply and demand, and factors that influence its price and overall market presence.
