
Have you ever wondered if just a single line on a chart could reveal hidden clues for trading? Think of it like turning a jumbled pile of numbers into a clear picture, kind of like following a simple map through a busy town.
With technical analysis, traders draw trendlines and mark key price points (key price points are spots on the chart that show where prices often turn or pause) to spot familiar patterns. These patterns help guide decisions on when to buy or sell.
In short, using simple visuals can turn everyday data into smart trade strategies. It’s like being able to see the signal in the noise, which helps lift your trades in a rapidly changing market.
Charting in Technical Analysis: Elevate Your Trades
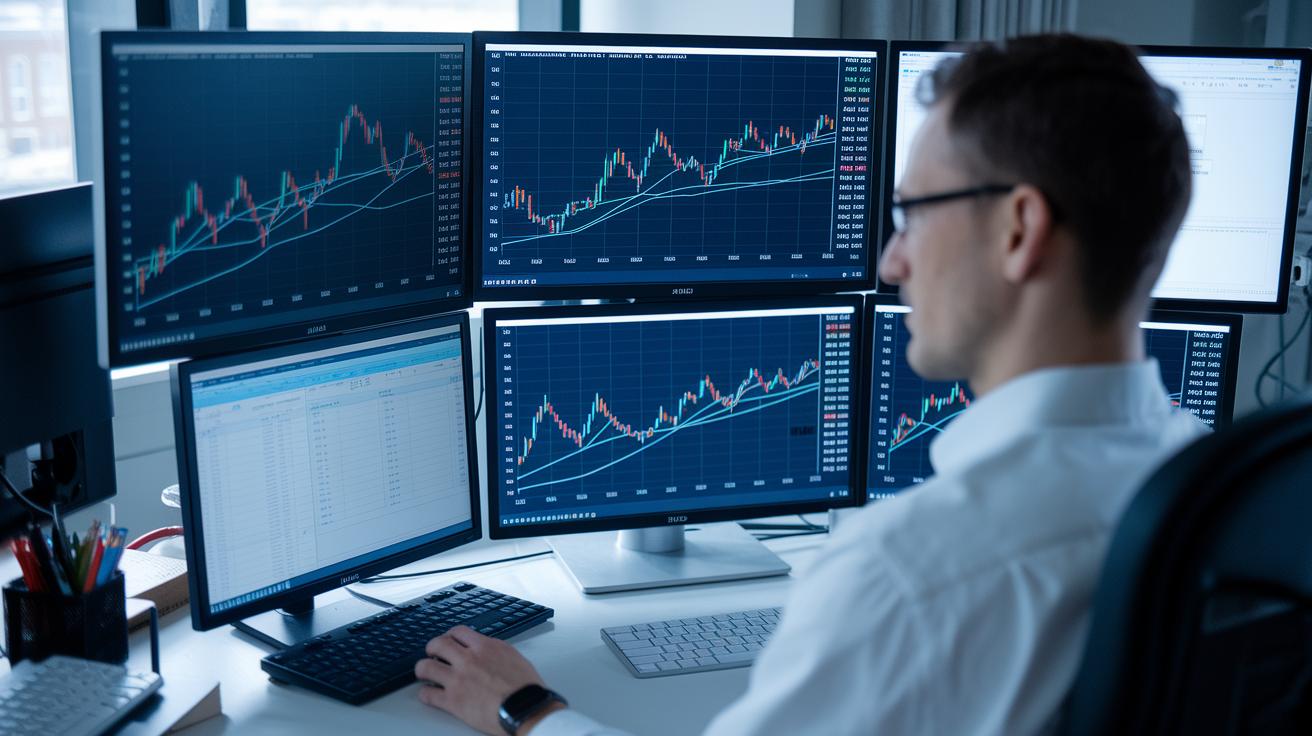
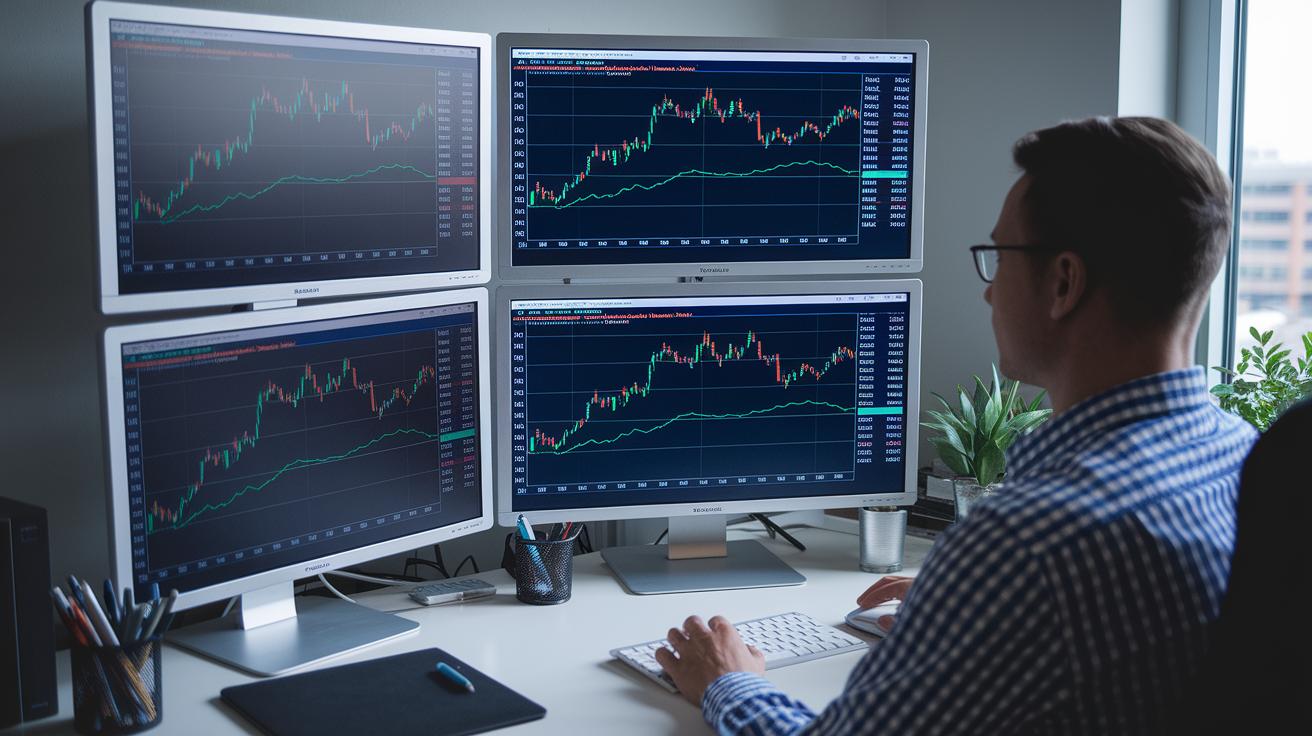
Charting in technical analysis is all about using easy-to-read visuals to track how prices change over time. Think of it like watching the steady pulse of a busy city, each beat can reveal hidden opportunities. These charts help traders quickly spot trends and signals for buying or selling, turning heaps of data into clear pictures.
Traders usually start by picking the best type of chart. Some go for line charts to follow closing prices, while others prefer bar charts that lay out key price points during a period. Then they draw trendlines and mark support and resistance levels, transforming raw numbers into a simple strategy. Imagine connecting everyday price changes like dots on a map; it guides you through a fast-moving market.
Seeing price data clearly is key for understanding market trends. This approach cuts through the clutter, helping traders focus on important signals and make confident decisions. If you're curious to learn more about the basics, check out What Is Technical Analysis in Investment for an easy introduction to this essential trading tool.
Essential Chart Types Used in Technical Analysis
Line Charts
Line charts track the closing prices with dots that connect to show how a trend moves over time. They’re easy to read and perfect for seeing long-term trends. Imagine drawing lines between your daily closing prices like joining dots in a simple connect-the-dots activity, each line gives you a hint about how steadily the market is moving.
Bar Charts
Bar charts show the open, high, low, and close prices in neat bars. Each bar tells a mini-story about the day's trading session, highlighting the highs and lows along the way. It’s a bit like reading a short narrative of market activity, making it easier to see how volatile prices can get.
Candlestick Charts
Candlestick charts use colored blocks and lines to capture the market’s mood, each one gives clues about whether prices might move up or down. You might see a lighter-colored block suggesting an upward trend, while a darker one could indicate a drop. In short, these charts let you quickly catch a glimpse of the market’s feelings through their colors and shapes.
Renko Charts
Renko charts focus purely on price changes by using bricks to mark every move, skipping over the time factor. This style smooths out the everyday noise, so you can really see if prices are in a steady trend upward or downward. Picture building a wall brick by brick, with each block clearly showing the direction the market is headed.
Point and Figure Charts
Point and Figure charts simplify things by marking only the major price shifts with X’s and O’s. They ignore the smaller ups and downs, which helps you spot important reversal signals more clearly. Think of it as making a minimalist drawing where every mark carries real meaning.
| Chart Type | Key Feature | Best For |
|---|---|---|
| Line Chart | Connected closing prices | Long-term trends |
| Bar Chart | OHLC visualization | Reading volatility |
| Candlestick Chart | Price action and patterns | Pattern spotting |
| Renko Chart | Price-only bricks | Clear trends |
| Point & Figure | Noise filtering | Reversal signals |
Building Accurate Charts in Technical Analysis

Before realizing the importance of precise chart-building, one trader noticed that a minor tweak in his trendline could lead to a 15% improvement in his risk management accuracy.
When you start charting, choose a chart type that fits what you need. For example, a line chart gives you a smooth view of price movement, but a candlestick chart shows more details about each session, like subtle changes in market mood.
Look at past price swings to draw clear support and resistance lines. Find spots where prices have often turned around. These clues help you decide where to adjust your stop-loss orders. For extra tips on keeping risks low, you can check our risk mitigation strategies.
Try refining your trendlines by testing them on small price changes. When you connect several important highs or lows, you might uncover shifts in momentum that a simple line could miss.
Pull all these ideas together by checking them against each other. For instance, when a solid trendline matches up with a confirmed support area, those small deviations might hint at future risk adjustments.
Pattern Recognition Skills in Charting Technical Analysis
Head and Shoulders Pattern
When you spot a head and shoulders pattern, you're really looking for a big peak in the middle – the head – flanked by two smaller peaks, the shoulders, connected by a line called the neckline. Once the price slips below that line, it often means a trend reversal might be coming. One trader once noted that just a small dip below a clearly drawn neckline triggered a 12% drop in a stock in minutes. It’s like watching a trusted signal warn you that a bullish move might be about to turn bearish.
Double Tops and Double Bottoms
Double tops show up when prices form two clear peaks, while double bottoms happen when you get two distinct lows. This pattern tells you the market is testing the same level twice. Imagine a seesaw where the balance is checked on both ends; once it breaks past that level, the trend shifts. It’s a simple, yet powerful way to see when market momentum might be changing direction.
Triangle Patterns (Ascending, Descending, Symmetrical)
Triangles are formed when the price highs and lows start closing in, making the range tighter. With ascending triangles, you often see an upward move when the price breaks out, while descending triangles suggest a drop might follow. Symmetrical triangles, on the other hand, show a balanced pressure that eventually picks a side. Picture drawing two lines that slowly move closer together until the market decides to make a clear move – that’s the essence of these triangle patterns.
Channel Patterns
Channel patterns are identified by drawing two parallel lines that run along the movement of the price. Trading inside these channels means you’re buying near the lower line and selling near the upper line. These boundaries give you a clear picture of steady trends and alert you to potential reversals when the price moves outside them. Charts like Point and Figure and Renko help cut through the market noise so you can stick to these clear signals.
Integrating Technical Indicators and Overlays in Charting
Adding technical indicators to your charts gives you a clearer look at the market mood. For instance, using a moving average overlay (a tool that smooths out price ups and downs) can help you see the overall trend on a candlestick chart.
Volume histograms bring another helpful layer. They display how many shares or contracts are traded over time, kind of like how each chapter in a book builds suspense. Each bar shows a burst of trading activity that backs up the price moves.
Oscillators such as RSI (Relative Strength Index, which measures how quickly prices change) and MACD (a driver of momentum shifts) are great for spotting reversals. When you see the RSI acting differently from the price, check out this example on divergence trading, it might signal that the trend is changing. And when the MACD’s signal line crosses above or below its moving average, it hints at a shift in momentum.
Putting these overlays together gives you a strong signal about where the market might be headed. They deliver clear cues like “Stocks Near A Buy Zone” or “Relative Strength at New High” and work smoothly with tools such as IBD Stock Analysis and Stock Screener.
In short, using these layers transforms raw market data into straightforward ideas you can act on.
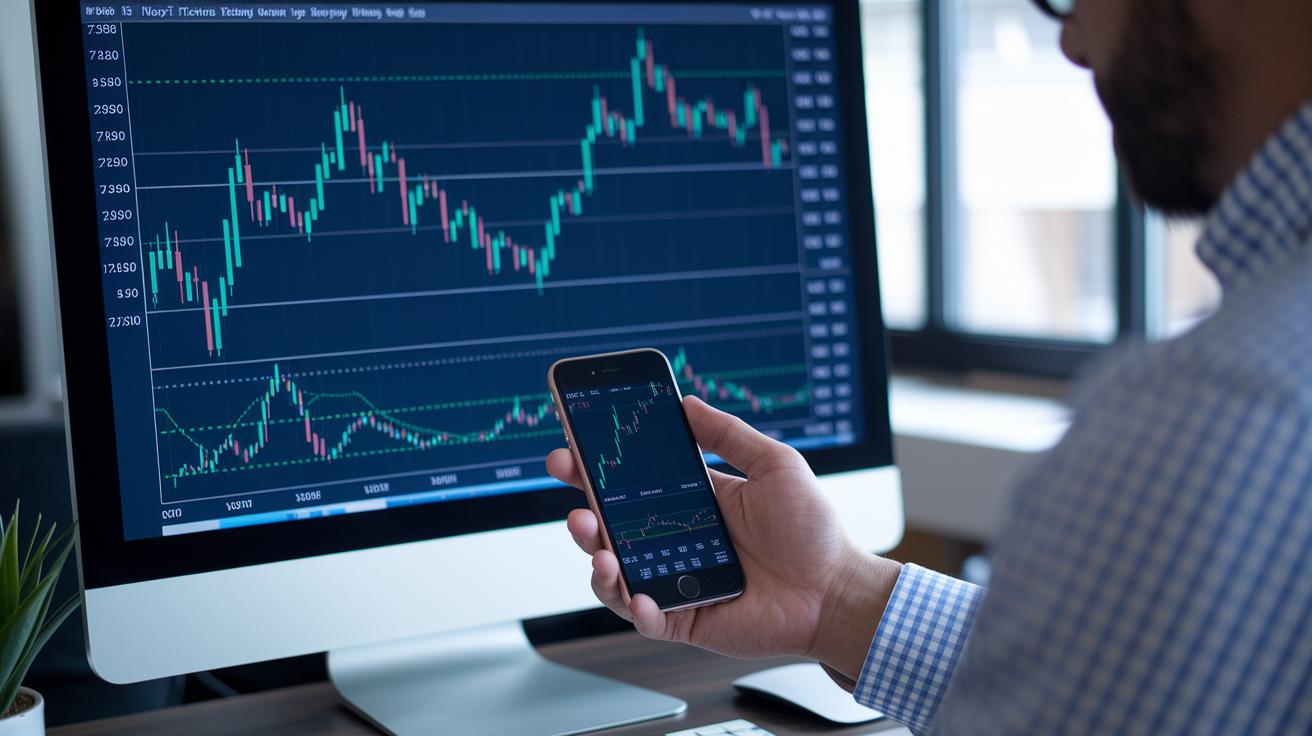
Software and Platforms for Charting in Technical Analysis
TradingView lets you explore markets with interactive, customizable charts that show trends in real time. Its free version gives you a solid start, and if you upgrade, you unlock extra drawing tools and unique overlay patterns (visual cues that help you spot trends) for deeper analysis.
MetaTrader is a favorite among forex traders because it combines strong execution methods with an easy-to-use mobile app. It comes loaded with a wide range of technical indicators (simple tools that hint at market shifts) and even lets you run strategies automatically. Then there's ThinkOrSwim, which features integrated graphs and detailed back-testing tools (methods to check past market moves) that help sharpen your trading approach. These platforms mix free tools with premium upgrades to give you a full suite of charting options.
Many of these systems also connect you to useful educational resources like online courses, podcasts, and workshops. Some even offer special deals, such as IBD Digital’s promotion, two months for $20, to help you build a strong technical analysis skill set. If you're diving into platforms that help with both basic and advanced charting, consider checking out investment analysis techniques to see how these tools might fit into your strategy.
Final Words
In the action, we broke down the essentials of charting in technical analysis. You explored using line, bar, and candlestick charts to reveal market trends and manage risks through support and resistance lines. We also discussed spotting key patterns and adding technical overlays for extra guidance in reading price movements. The article rounded out with a look at reliable platforms for creating clear visual data. Keep charting and building a robust digital asset portfolio with confidence and a positive view of the market.
FAQ
What is charting in technical analysis and finance?
Charting in technical analysis means plotting price data on graphs to track trends and signals. It provides traders with a visual tool to quickly spot market movements.
What is the best chart for technical analysis?
The best chart is often the candlestick chart because its detailed patterns clearly show price shifts and reversals, making it a favorite among many traders.
What are the 4 pillars of technical analysis?
The four pillars typically include price movements, volume, trend lines, and momentum indicators. These elements work together to give traders a complete view of market conditions.
How can I access free PDFs and examples about charting in technical analysis?
Free PDF guides online offer practical examples and beginner insights on reading stock charts and different chart types. They serve as an accessible introduction for new traders.