
Ever thought that the market's mood might hint at your next smart move? When what investors feel mixes with big news and key price numbers, little clues appear about what might happen next. It's like snapping a quick group photo of everyone's thoughts, showing you if it's a good time to buy or sell. In short, this post breaks down how to spot and use these insights so that tracking price shifts becomes easier and you can feel more confident about your decisions.
how to interpret market sentiment: Clear insights
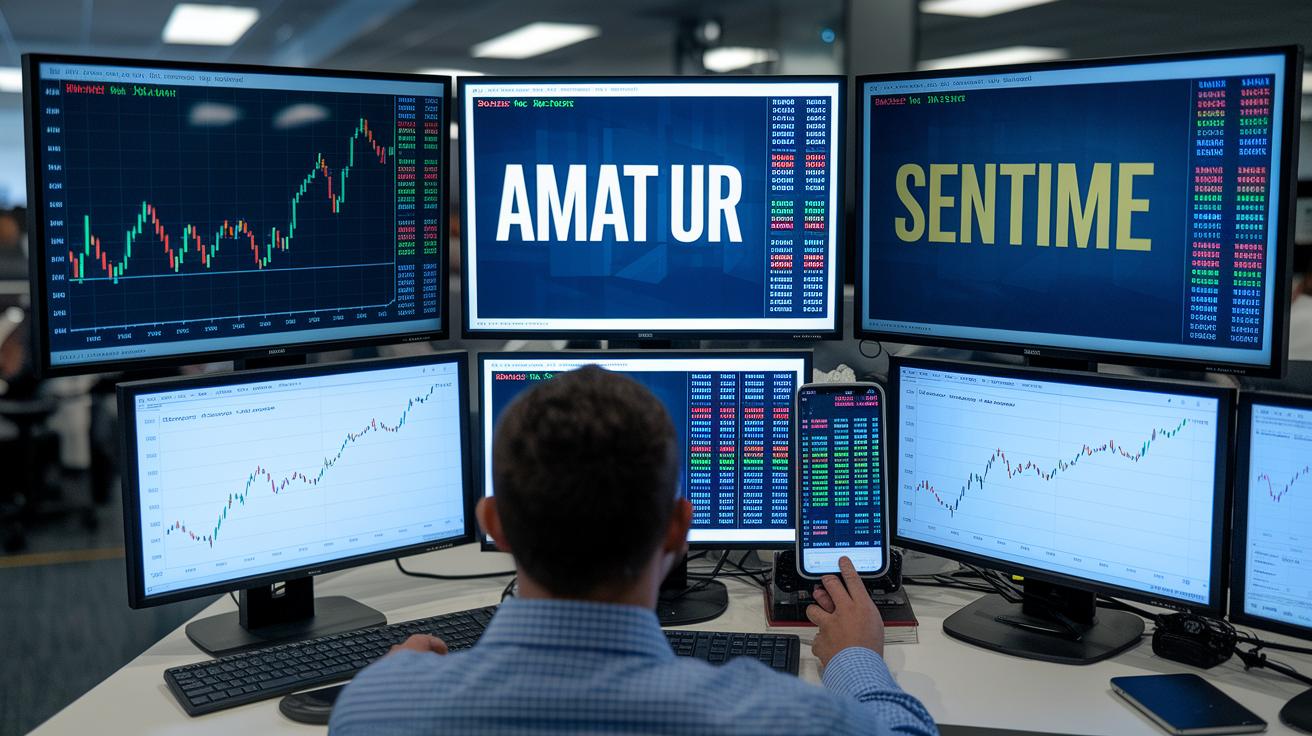
Market sentiment is like a snapshot of the mood among investors. It shows how people feel about the markets right now by mixing everyday opinions and media stories with solid facts like price history and key economic events. Advanced analytics, tools such as machine learning (a way for computers to learn from large amounts of data) and natural language processing (tech that helps computers understand our everyday language), scan huge piles of data to spot trends that might hint at what’s coming next.
Understanding this sentiment matters because it gives clues about when buying or selling might heat up. For example, if a big tech company announces a major innovation, the burst of positive feelings can spark a wave of buying that pushes prices higher, much like a booming cheer lifts a sports team’s spirit.
- Public opinion polls
- Media coverage tone
- Price momentum patterns
- Economic event reactions
- Social media mood
- Volume surges
Investors often mix these sentiment signals with other types of analysis to fine-tune their trading moves. They might look at technical data, like moving averages (a simple way to smooth out price changes over time), or dive into fundamental reports that explain a company’s cash flows. Imagine an investor saying, "When the mood is high and the charts back it up, it feels like spotting a familiar pattern that screams it’s time to act." By combining these different clues, they can better time when to jump in or step back, bringing together both the human touch and the solid numbers for a well-rounded investment approach.
Technical Tools for Gauging Market Mood
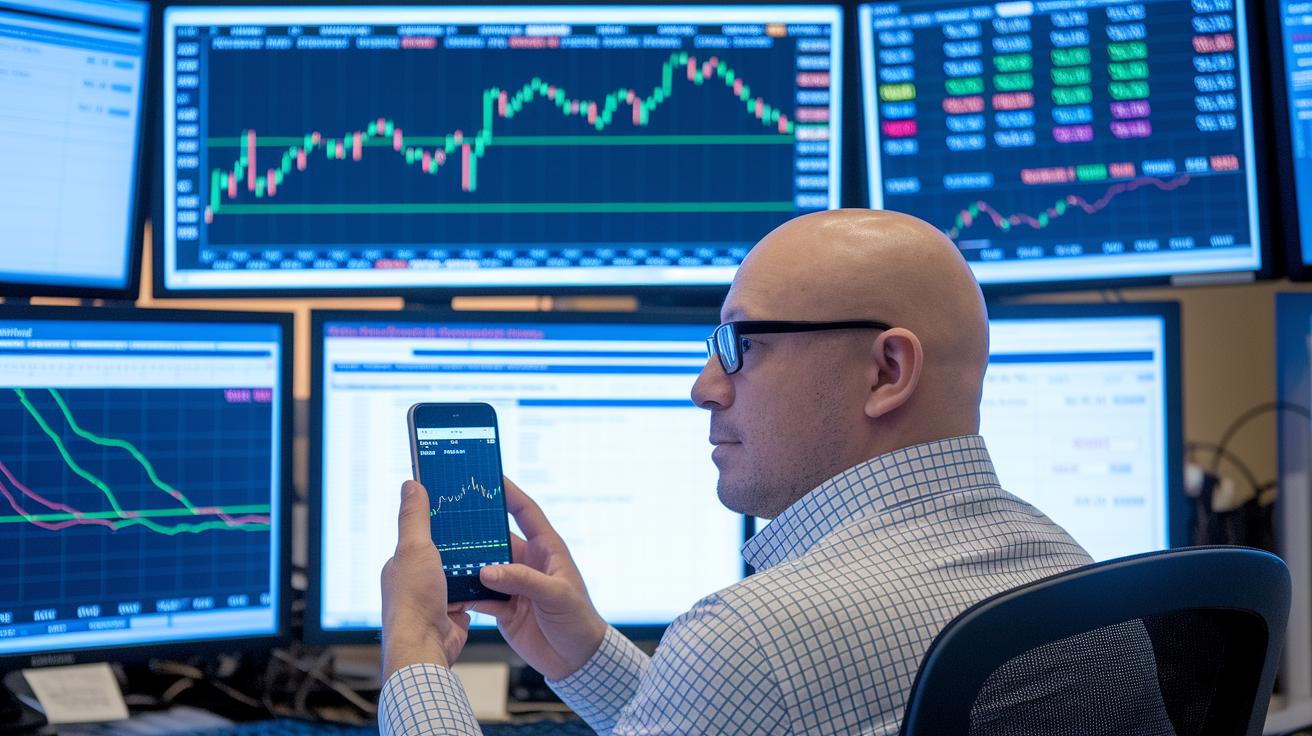
Chart-based tools show us numbers that help explain how the market is feeling. They take things beyond simple gut feelings and make it easy to see if prices are swinging widely or staying on trend. Tools like the VIX (a measure of market risk, which tells you how risky the market might feel) and the 200-day moving average (a gauge of long-term trends, meaning it shows overall market direction) give investors clear signals about whether to be cautious or optimistic. For a deeper look at how these numbers fit into a bigger picture, check out what is technical analysis in investment.
| Indicator | Type | Signal |
|---|---|---|
| VIX | Volatility | Risk-on vs. risk-off |
| 200-day MA | Trend | Long-term bullish/bearish |
| High/Low | Breadth | Market strength |
Mixing these number-based clues with platforms that gauge overall sentiment gives investors a clearer picture of market mood. These indicators work in tandem with big-picture data like GDP trends and shifts in tax policy to show a full view of how the market is moving. And when you combine this detailed technical insight with live sentiment scores, you get a more trustworthy signal on when to enter or exit the market. In short, this balanced way of looking at things helps smooth out the chatter and better reveal real shifts in investor behavior.
Sentiment Signals from News and Social Media

Media plays a big role in shaping how investors feel. A single headline can shift market mood, sparking a buying rush or causing a quick sell-off. When stories sound overly positive, they can lead to overconfidence and push prices higher than they should be. But when news is negative, investors often act with caution and pull back. This back-and-forth between headlines and market moves is a key clue for anyone watching sentiment.
| Source | Description |
|---|---|
| Financial news headlines | Main headlines that drive market mood |
| Social media sentiment feeds | Real-time public reactions online |
| Trend analytics (Google Trends) | Search trends showing what’s on people’s minds |
| Specialized sentiment platforms (Semantic Visions) | Tools that read the tone in news and posts |
| Forum chatter (Reddit, StockTwits) | Community discussions and opinions |
By checking these sources, investors can feel the market’s heartbeat in real time. These channels not only capture immediate reactions but also reveal trends that tend to repeat. When you blend this live sentiment with tools like moving averages (a simple way to smooth out price data) or volatility measures (an easy gauge of price changes), the insights become even clearer. This combination of live mood indicators and traditional charts helps paint a full picture of market dynamics, so you can make more informed decisions that mix both the emotion behind the numbers and the trends shown by the data.
Interpreting Survey-Based Sentiment Measures

Survey-based sentiment tools let us peek into the market’s mood by gathering both opinions and real data on how investors are positioned. When these feelings hit extreme levels, they can sometimes hint that the market might be ready for a change.
AAII Investor Sentiment Survey
This survey runs each week from Thursday to Wednesday Eastern Time, with its results shared every Thursday morning at 9:30 AM ET. It collects views from thousands of everyday investors on whether they believe the market will rise, fall, or stay steady. When most investors feel overly optimistic or pessimistic, it often serves as a contrarian clue, a sign that the market might be nearing a turning point. For example, if nearly everyone is overly positive, that could be a hint that the market may have peaked, so it might be wise to pause and reassess before jumping in.
CNN Fear & Greed Index
The CNN Fear & Greed Index combines seven different pieces of data such as momentum (the speed of price changes), market breadth (how many stocks are moving up or down), the put/call ratio (a simple look at trading bets), and junk bond spreads (the difference in yields between riskier bonds and safer ones). These inputs are merged into a score between 0 and 100. A low score means investors are feeling fearful, while a high score shows they’re driven by greed. This gives a quick snapshot of how much risk people are willing to take.
NAAIM Exposure Index
Unlike surveys based on opinions alone, the NAAIM Exposure Index looks at weekly data from professional investment managers. It reports whether they are net long (betting on rising prices) or net short (betting on falling prices). This measure reflects the actual mix of assets these professionals hold and nicely rounds out the picture you get from survey-based tools.
By putting together these survey insights with technical tools and news sentiment, investors can get a clearer view of market trends. This blended approach helps in making smarter decisions about when to trade.
Integrating Sentiment Data into Trading Strategies

Smart trading starts when you mix the market’s mood with solid price and volume clues. This method blends the feelings of the market with clear numbers to help you figure out when to jump in or step back. It’s like combining different flavors in a recipe to smooth over uncertainty, especially when the market feels extra wild.
- Start by gathering sentiment info from a few places, think surveys, social media chatter, and technical signals (basically indicators that show trends).
- Check those extreme numbers by comparing them with price moves and familiar chart shapes.
- Look back over the last 2 or 3 market cycles using trusted backtesting methods to see if the signals really work.
- Then, set your position sizes and risk limits based on those strong sentiment moves to keep your portfolio safe.
Many traders build strategies based on the market’s emotions by mixing sentiment research with price trends and chart patterns. This process helps confirm if a turn in the market is real, especially when readings are unusually high or low. By gathering reliable data from different sources, you can tell if a spike is genuine or just random noise. With a steady approach and small adjustments along the way, you can fine-tune exactly when to buy and sell.
Regular check-ins, paired with smart investment analysis tools, make sure your strategy keeps pace with changing market moods while still watching risk. It’s like adjusting the dial on your radio until the tuning is just right.
Measuring Market Sentiment Reliability and Common Pitfalls

Sentiment tools depend on both good data and smart algorithms. When these tools work with messy or biased information, the signals can be off, leaving you to wonder if a change in investor mood is real or just random noise.
Traders should always be careful about their own biases. It’s easy to follow what everyone else is doing or to overreact to the latest news. Trusting only an immediate gut feeling might steer you away from seeing longer-term market trends.
A good way to get a clear picture is by checking signals from several different sources and mixing them with both technical and basic analysis (looking at numbers and the overall financial picture). This balanced approach can help stop you from acting on just one misleading signal. Having a firm plan with clear risk limits and frequent signal reviews also keeps your decisions on track.
When you treat sentiment data as just one part of your decision-making, you build a more stable approach to trading. Seeing the whole picture and regularly checking all these signals can help you time your moves better while staying focused on overall market trends. In short, using a mix of information can lead to smarter trading choices.
Final Words
In the action, we walked through key elements such as sentiment basics, chart tools, social and survey signals, and blending them into strategies. We looked at how investor mood can drive price moves and how these signals work together with chart patterns.
Highlights included:
• Understanding investor sentiment
• Combining technical data with real-time news
• Using surveys to gauge market mood
Keep this insight handy as you learn how to interpret market sentiment for a well-rounded, dynamic investment approach.
FAQ
How do you interpret market sentiment in forex and other markets?
Interpreting market sentiment means analyzing investor feelings using public opinion, news, and technical data like price momentum. In forex, these insights help predict potential market moves.
What does market sentiment today mean?
Market sentiment today reflects the current investor mood based on real-time data such as news trends and chart signals. It offers a snapshot of whether optimism or pessimism prevails.
What are sentiment indicators and how are they measured?
Sentiment indicators are tools that assess investor emotions through technical charts, surveys, and social media feeds. They measure inputs like volatility and trading volume to give clues about market confidence.
What does bullish sentiment mean?
Bullish sentiment means investors are feeling optimistic, leading to buying pressure. This positive mood often results in rising prices since more participants are confident in market gains.
How can I read market sentiment charts and use TradingView indicators?
Reading market sentiment charts involves studying trends, technical signals, and volume patterns. With TradingView, sentiment indicators merge analytical data to highlight shifts in investor mood for better trade decisions.
What does low sentiment mean?
Low sentiment indicates a cautious or negative investor mood. This can lead to increased selling pressure, as market participants react to doubts or unfavorable news about market conditions.
