
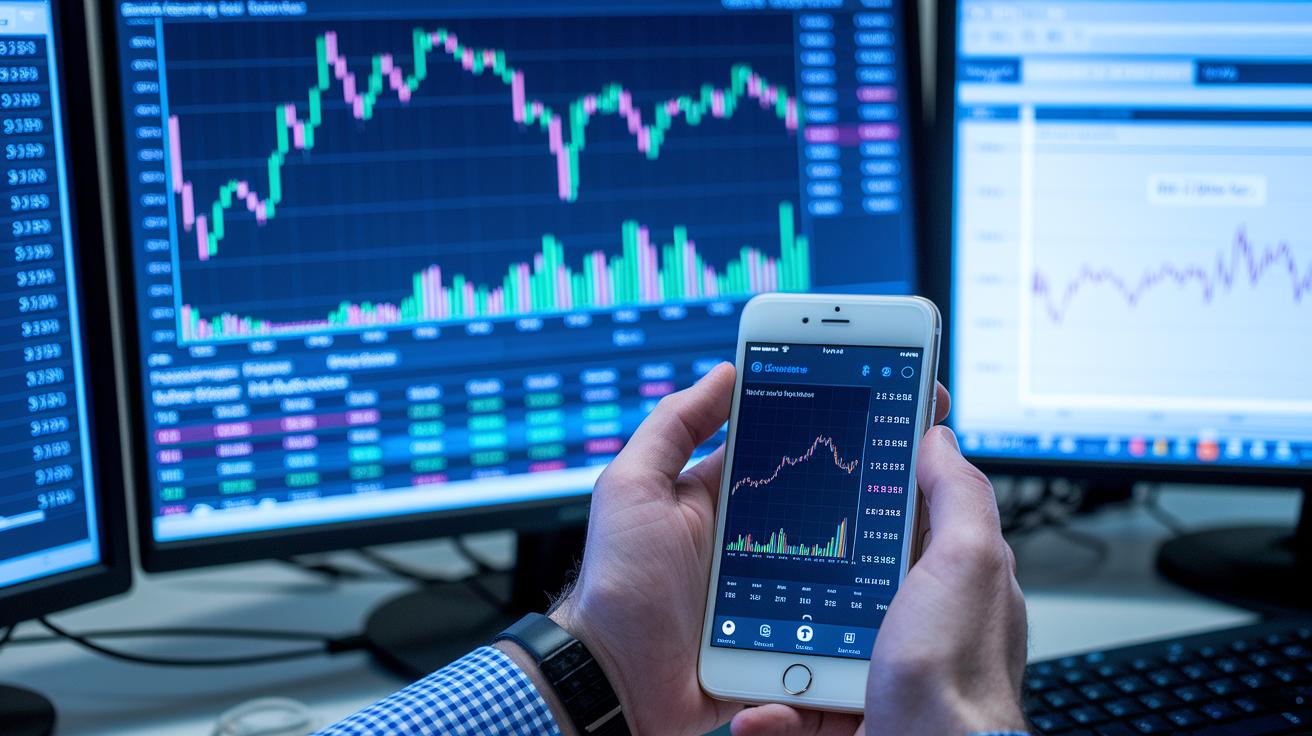
Have you ever thought about what really boosts trading confidence? Market sentiment indicators are like a blend of hard numbers and gut feelings, they combine clear data with the real emotions of investors.
These tools tell you if traders are leaning toward bold moves or playing it safe. It’s almost like getting a sneak peek at what’s coming before the official reports drop.
Imagine them as a weather vane that shows when the market winds are shifting. This mix of numbers and intuition helps you plan your moves and trade with a bit more confidence.
Understanding Market Sentiment Indicators
Market sentiment indicators show us how investors are really feeling. They point out if people are in a "risk-on" mood, eager to take chances, or a "risk-off" mood where caution wins. These tools mix hard numbers with a bit of gut feel. For example, moving averages (a way to smooth out price changes) help reveal trends, while software scans conversations to catch the real emotions buzzing in the market.
Imagine a trader who sees moving averages steadily climbing. This usually signals growing buyer confidence, even if traditional reports look quiet. At the same time, software scanning social media tells us if the overall vibe is upbeat or cautious. It’s like having an extra pair of eyes that capture the market’s mood in real time.
Unlike deep dives into a company’s balance sheet, these indicators focus on the live feeling of the market. They show us that sometimes, the collective mood can move prices even if the numbers on the balance sheet don’t change much. It’s a bit like listening to the subtle hum of digital transactions that tell a story beyond just numbers.
Traders lean on these insights to decide when to jump in or back off. Think of it this way: when a trader sees a jump in their confidence indicator, it’s like hearing the starting gun and feeling that rush to sprint forward. By combining clear data with real-time sentiment, this approach helps paint a fuller, more human picture of market behavior.
Technical Market Sentiment Indicators: Moving Averages & Chart Patterns

Moving averages like the 50-day or 200-day ones are a trusted checkpoint for traders. They smooth out wild price swings so you can clearly see the trend underneath. For instance, when a short-term average crosses above a long-term one, it might be the first hint of a new trend, almost like noticing a change in the weather.
Then there’s the momentum oscillator, a handy tool that measures how fast prices are moving. It shows whether buyers are pushing prices up or if sellers are stepping in to pull them down. I once saw a sudden jump in a momentum oscillator signal a quick market shift, something that many missed in the rush. It’s a reminder that even amidst fast action, the right tool can capture the market’s steady beat.
Chart patterns add another layer to this picture. Patterns like head-and-shoulders or flag shapes act like clues into market mood shifts, hinting that a bullish phase might turn bearish or the other way around. It’s almost like reading someone’s facial expressions; these patterns give a visual sense of when the trend is ready to change course.
Finally, technical divergence signals step in when price motions and indicators don’t match up. This mismatch can suggest that the current trend is losing its strength, possibly hinting at a reversal. By combining these tools, moving averages, oscillators, chart patterns, and divergence signals, traders can get a full, human-friendly picture of the market’s emotional state, spotting both strong trends and potential risks ahead.
Options & Volatility as Market Sentiment Indicators
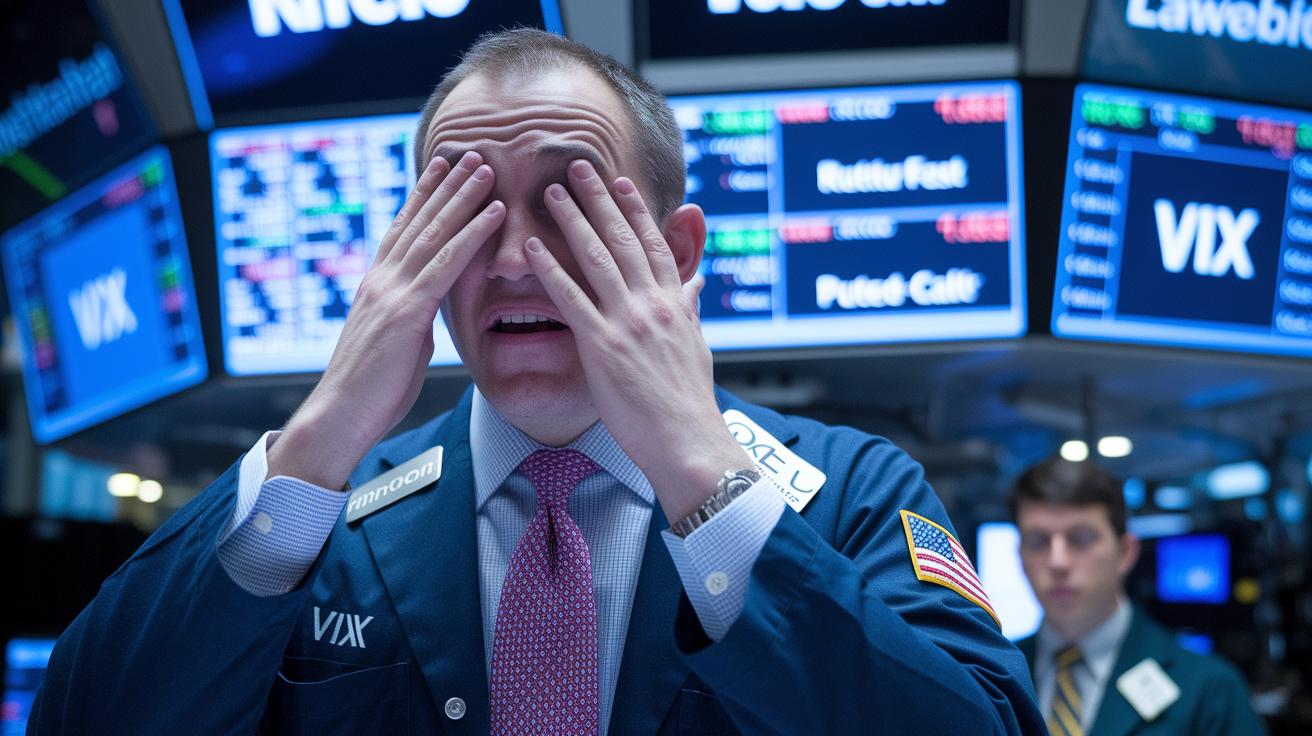
The VIX, or Volatility Index, shows how scared the market might be by tracking changes expected over the next 30 days. Many traders call it the fear gauge because when the VIX jumps, it often means people are panicking and prices can drop quickly.
Imagine a time when a high VIX made investors rush to cut their losses as prices tumbled in just minutes. This kind of index gives us clear clues about how willing people are to take risks.
Other tools, like the put-call ratio, compare the volume of bets that prices will drop (bearish) versus rise (bullish). When this ratio climbs, it usually means traders are acting carefully. But when it stays low, it shows traders are feeling more confident and ready to take on risks.
There are also signals from circuit breaker alerts and implied volatility skew. These help us understand just how extreme market conditions can get. High readings might mean that fear is clouding judgment, while low readings can create a feeling of calm that might hide some risks.
For example, if a trader sees both a low VIX and a favorable put-call ratio, they might take that as a sign that the market is calm, which can boost their confidence to trade. These options-based measures help everyone, from day traders to long-term investors, make smarter decisions by clearly showing the market’s mood.
News & Social Media Market Sentiment Indicators
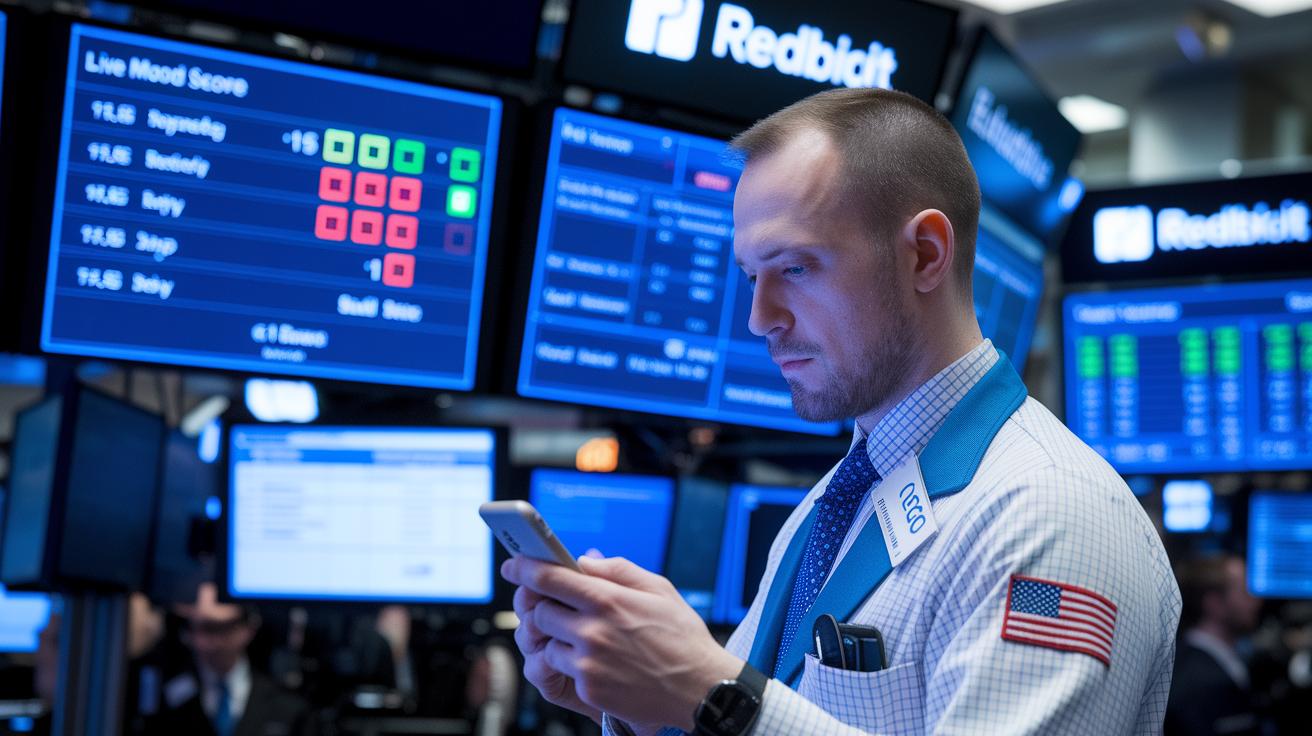
Sentiment analysis tools comb through headlines, tweets, and online forums to create a live news mood score. This score helps traders feel the market’s emotional beat. For example, if a flurry of negative tweets about a well-known company suddenly appears, it might be hinting at a coming dip. Think of it as a smart little tool that picks up on tiny shifts in how investors are feeling.
Media coverage is a big deal here. Positive stories can spread quickly, boosting confidence and sometimes even creating a bubble. On the flip side, a barrage of gloomy headlines might trigger a rush to sell. One trader once mentioned that when Twitter’s mood shifted, it felt like the entire market took a deep, calming breath just before a big storm hit.
Qualitative dashboards mix social listening data with simple sentiment surveys to give you a rounded view of market mood. This setup works a bit like an emotional tracker, highlighting quick spikes in negative news that often come right before stocks or crypto prices drop.
By staying tuned to these signals, investors can tweak their trading strategies in time. If social news indicators show a clear mood swing, it might be a nudge to double-check your current positions and closely review the market trends before making any moves.
Market Sentiment Indicators Spark Trading Confidence

Big-picture economic factors set the tone for market mood. When GDP is strong, unemployment is low, and interest rates remain steady, it feels like a burst of optimism sweeps through the trading floor. Ever notice how a sudden rise in GDP can flip the market from quiet to buzzing confidence in no time?
A strong GDP along with low inflation usually tells investors they can take smart risks. On the other hand, high inflation or political uncertainty can make everyone a bit more careful. It’s like cooking a meal, each ingredient, from job numbers to interest rates, adds its own flavor to the overall market vibe.
Mix in these broad economic signals with live sentiment readings, and you get a clearer picture of trading opportunities. This blend of solid numbers and real-time mood helps traders spot the perfect moment to act when both the facts and feelings line up just right.
Market Sentiment Indicators Spark Trading Confidence

Market sentiment indicators act like a thermometer for investor feelings, giving us a snapshot of when traders are feeling either really fearful or overly greedy. They help guide decisions by signaling extreme moods. Some traders even use tools like the Fear & Greed Index, as a simple gauge of trading psychology, to decide when it might be smart to buy or sell. One trader remembered, "Back in 2008, when the VIX (a gauge of market volatility) spiked and put-call ratios fell, it clearly signaled a good time to jump in."
Trend-following traders often mix these mood measures with checks on price movement. They wait until moving averages (a quick look at average prices over time) confirm a rising trend and sentiment tools show that lots of buyers are eager. This mix gives them a solid sense of when market excitement is at its peak.
By adding tools like investment analysis techniques into your strategy, you can fine-tune your moves, using both clear data and the subtle heartbeat of market sentiment.
Limitations & Best Practices for Market Sentiment Indicators

Sometimes market mood indicators can send the wrong signal when trading volume is low or when someone is trying to game the system. It’s a bit like having a decision tool that misfires exactly when you need it most.
One trader once said, “I trusted one indicator, and the market turned against me unexpectedly.” That experience shows how leaning on a single gauge can lead to surprises.
When you rely on just one kind of indicator, whether it’s a behavior measure, an algorithm gauge (which checks automated trends), or that decision tool, you risk unexpected pitfalls. Mixing different tools can help cut through the noise and capture the true pulse of the market more reliably.
Here are some best practices:
- Use multiple sentiment metrics to cross-check signals.
- Test these signals against past price data to avoid those sudden reversals.
- Compare current readings with basic fundamentals to spot any early differences.
Following this balanced approach, where you combine several measures and historical comparisons, can help you reduce errors and build a tougher trading strategy. By mixing objective past performance with today’s market vibes, you can control risk better and avoid decisions based solely on fleeting feelings.
Final Words
In the action, we've seen how market sentiment indicators shape trading decisions by merging technical analysis, options metrics, and real-time news insights. They reveal shifts in market mood and risk appetite that traditional measures might miss. Breaking down moving averages, volatility gauges, and social media trends helps investors understand subtle market pulses. Combining these tools can boost digital investing confidence and pave the way for smart, diversified digital asset portfolios. Stay curious, keep monitoring trends, and let market sentiment indicators guide you toward informed decisions.
FAQ
What is market sentiment and how do I read it today?
The market sentiment today reflects the overall mood of investors. It shows whether traders feel optimistic or cautious, which can influence price changes even when fundamentals stay the same.
What are sentiment indicators and which ones are most helpful?
Sentiment indicators are tools that gauge the emotional state of the market using price trends, trading volumes, and news data. They help traders decide when to be careful or take a chance.
How can I use free tools like TradingView to track market sentiment?
Free tools on TradingView offer charts, moving averages, and variations of the Fear and Greed Index. They provide real-time sentiment insights at no extra cost to help guide trading decisions.
What does the Fear and Greed Index tell me, and how do I use it today?
The Fear and Greed Index measures whether investors are leaning toward caution or risk. It uses current data to signal market feelings, helping you decide on potential buying or selling moments.
Which sentiment tracker is best for stocks?
A top sentiment tracker for stocks blends technical analysis with news and social data. Tools that combine charts with real-time emotional signals, like the Fear and Greed Index, are popular among traders.