
Have you ever thought about how scribbled numbers grew into computer models that now shape big money decisions? In the early days, simple hand-drawn charts of stock trends sparked the move to smart, computerized methods. Picture it like upgrading from a paper map to a digital one that guides you every step of the way. This post walks you through those key moments when financial modeling shifted, paving the way for the tools we trust today. In short, it's a look at how hard work and fresh ideas changed the way we view money and investments.
Historical Foundations and Milestones in Financial Modeling
Back in the early 1900s, financial models were made entirely by hand. Analysts sketched out stock trends with simple math and drawings, kind of like drawing a map with every twist and turn marked out. Each handmade model was filled with hope and a touch of caution during uncertain times.
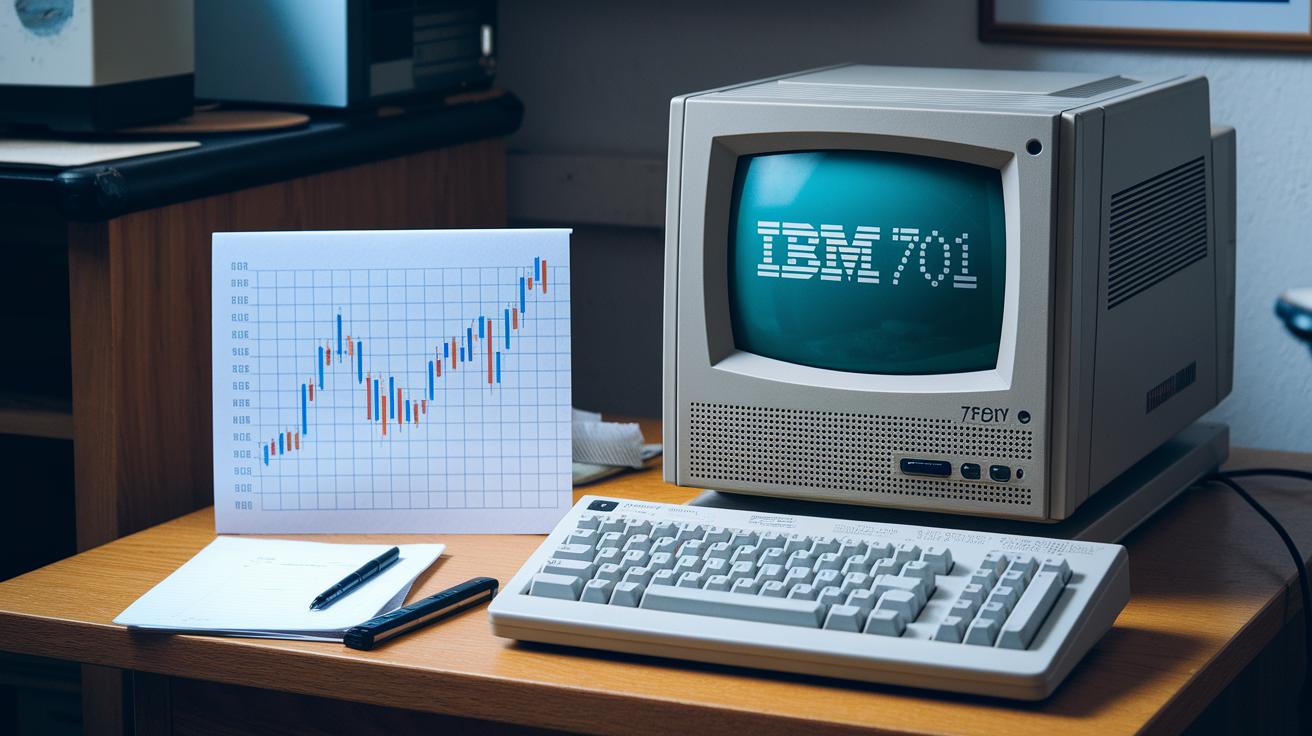
By the 1950s and 1960s, things took a big turn. Mainframe computers like the IBM 701 began to handle data much faster than ever before. This change meant that analysts could crunch numbers quickly and with more accuracy, a bit like switching from handmade toys to a speedy assembly line that produced consistent results.
| Year | Milestone | Impact |
|---|---|---|
| 1900s | Handcrafted stock-market models | Guided early investment decisions |
| 1950s–60s | Mainframe computer simulations | Enabled faster quantitative analysis |
| Late 1970s | Emergence of spreadsheet concept | Paved way for democratized modeling |
These breakthroughs paved the way for today’s tools. Moving from manual calculations to automated methods set the stage for digital models that anyone could use. When spreadsheets arrived in the late 1970s, they brought financial analysis right into everyday hands, a truly exciting leap in the evolution of financial modeling.
Spreadsheet Revolution in the Evolution of Financial Modeling
Spreadsheets changed the game for financial forecasting, turning a once-special skill into something anyone could use. They made it possible to check values and risks in real time, letting us dive into the numbers with ease.
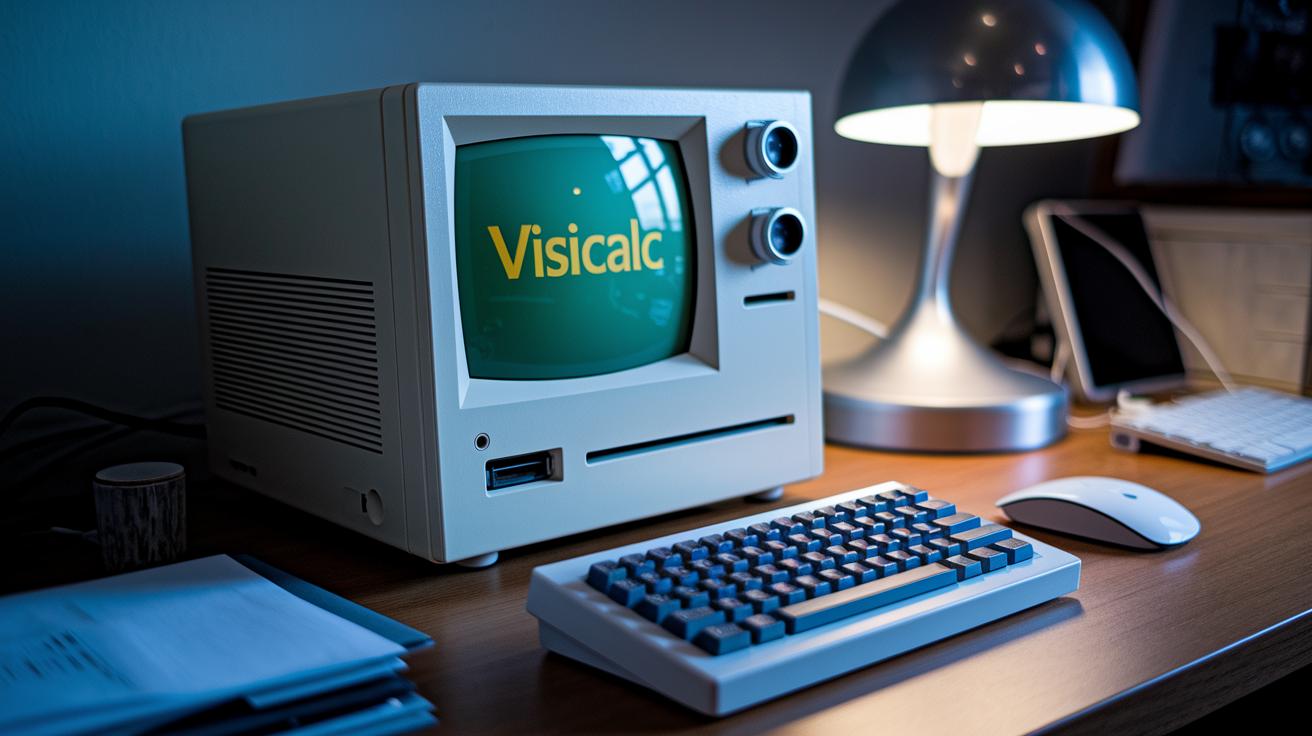
VisiCalc and the Birth of Electronic Spreadsheets
In 1979, VisiCalc, which fit on an 80 KB Apple II floppy disk, gave people the power of instant recalculations. It waved goodbye to slow, manual updates and let users see fresh results on the spot. Imagine turning your computer into a handy tool that makes financial guessing as simple as pie.
Lotus 1-2-3’s Integrated Charting and Database Features
Lotus 1-2-3 came along in 1983 and added built-in charting and database capabilities. This meant you could track visual trends and keep your data tidy all in one place. Think of it like mixing the perfect recipe where every ingredient fits just right to create an easy-to-follow forecast.
Excel’s Market Dominance and Feature Evolution
Since 1987, Microsoft Excel has grown to include more functions and a user-friendly design. Its powerful features help millions analyze details like risk and value with confidence. In short, Excel shows how spreadsheets turned complex projections into a tool that’s both simple and smart.
Methodological Advances and Software Innovations in Financial Modeling

Financial modeling has come a long way. Early on, we relied on basic spreadsheets that were flexible but not always spot-on for complex calculations like risk analysis. Now, we use organized frameworks that check every number as you go, like upgrading from a rough sketch to a detailed blueprint that helps prevent mistakes.
Practical Financial Modelling, first released on August 13, 2015, brought together years of hands-on experience into one handy guide. It set clear standards for accuracy, design, and error checking. Think of it like following a trusted recipe where every ingredient is measured just right, ensuring that your model turns out perfectly balanced.
The OAK Excel add-in is another big leap forward. It wraps together model audits, tax, and accounting work into one tool, catching errors in real time. That means you get a built-in quality check that stops small mistakes from growing into big problems. Instead of juggling separate systems, you have everything in one simple package.
Operis Academy is also leading the way by offering courses that build strong, disciplined modeling skills. Their classes show you step-by-step methods to tackle challenging fiscal estimates and risks. Imagine sitting in a class where each lesson boosts your confidence and skills, helping you design models that are not only accurate but also innovative.
Data Analytics, Machine Learning, and High-Performance Computing in Financial Modeling

Old spreadsheets began to struggle as models grew more complex and datasets ballooned. They just couldn’t keep up with today’s detailed financial forecasts. So, businesses shifted to scalable analytics that handle huge data sets and offer real-time insights, kind of like trading in an old car for a speedy new ride.
Big data has changed the game by merging different sources of information with cloud-based tools. Picture a system that pulls in live market updates, social trends, and economic news all at once, processing it as it comes. Cloud platforms now crunch numbers at lightning speed, giving you forecasts that update instantly with every new piece of data. It’s like tweaking your recipe on the fly when you get fresh ingredients. Did you know major firms boosted their accuracy by mixing real-time insights with traditional methods? It’s similar to a chef balancing flavors at the very last minute.
Machine learning also steps in to refine what we know. These smart algorithms spot patterns in credit scoring and asset pricing that even experienced analysts might miss. They learn from new data and adjust predictions as the market shifts, cutting down the guesswork.
High-performance computing takes financial modeling to the next level. With powerful processors and cloud support, massive Monte Carlo simulations, where thousands of outcomes are calculated almost instantly, are now possible. This speed not only shortens analysis time but also gives a clearer view of potential risks and rewards. In short, modern tech is transforming financial forecasting into a more precise science.
Future Trends and Emerging Technologies Shaping the Evolution of Financial Modeling

Recent studies on mergers and acquisitions, along with VDR best practices and fee guides for 2025, show that our financial models are evolving quickly. Financial teams are streamlining merger assessments and due diligence, like refreshing an old playbook with smart new strategies that keep every move calculated and secure.
Blockchain insights and decentralized data are changing how we handle valuation and due diligence. Blockchain acts like a clear, secure ledger that everyone trusts, which cuts down on any chances of data tampering. Meanwhile, decentralized data brings in a mix of pricing insights from many sources, giving analysts a fuller view of market trends. It’s kind of like getting extra perspectives that help make your forecasts brighter and more reliable.
AI-powered, cloud-based analytics and smart computation frameworks are the next big thing. These modern tools promise real-time updates and detailed scenario planning, so financial pros can adjust quickly as market conditions change. Ever notice how a fast-moving market calls for a fast response? This new technology is here to help you stay ahead.
Final Words
In the action, we traced a timeline from handcrafted models and mainframe simulations to the rise of spreadsheets and modern analytics. We saw how innovative software and smart algorithms have refined model accuracy and accessibility.
Every stage in this evolution of financial modeling has paved the way for sharper decision-making and robust strategies. The blend of past milestones with today’s digital tools helps build a secure, diversified digital asset portfolio, leaving us feeling confident and ready for what’s ahead.
FAQ
What is the evolution of financial modeling timeline?
The evolution of financial modeling timeline begins with early manual models in the 1900s, transitions through computer simulations in the 1950s–60s, and develops into spreadsheet-based methods by the late 1970s.
What does the evolution of financial modeling Wikipedia entry explain?
The evolution of financial modeling explained on Wikipedia outlines how early handcrafted methods transitioned into faster computer simulations and later into accessible electronic spreadsheets, marking each major milestone in the field.
What do financial modeling notes reveal about its history?
Financial modeling notes reveal a clear progression from manual stock-market models, through mainframe-assisted forecasting, to the modern use of spreadsheet tools, highlighting key shifts in analysis techniques.
Can ChatGPT do financial modelling?
ChatGPT can explain financial modeling ideas, offer examples, and clarify technical concepts, but it does not perform live financial analysis or generate complex forecast models in real time.
What are the three phases of the evolution of financial management?
The three phases of financial management evolution include early manual calculations, the rise of computer-based simulations, and the advent of user-friendly spreadsheet models that expanded access to financial projections.
What is the 3 model financial model?
The 3 model financial model is generally structured into three parts that cover historical performance, current status, and future projections, providing a clear framework for financial evaluation and planning.
How is the financial industry evolving?
The financial industry is evolving with the use of scalable analytics, machine learning, and cloud-based tools that lead to faster analysis, more accurate forecasts, and improved methods for valuation.